

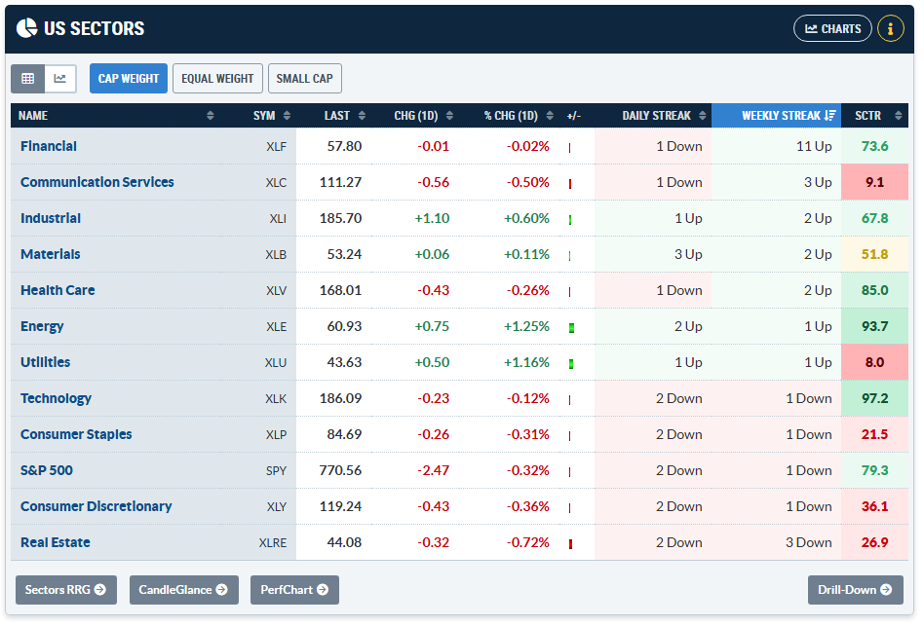
Summer is hot, and the financial world is even hotter. The group of banks, insurance companies, and asset managers has gone up for ten weeks straight and is trying to reach a record eleven weeks.
Big banks like JPMorgan Chase and Bank of America posted strong second‑quarter results. Insurance firms rose in June, and Berkshire Hathaway touched a year‑high. Asset managers also saw fresh buying.
The Next Spark: Jensen Huang
Earlier this week, NVIDIA’s chief, Jensen Huang, met with leaders from six major Wall Street firms. They discussed a new platform that could raise $500 billion from outside investors. The idea is to create a new asset class, similar to mortgage‑backed securities, that would fund huge AI projects without putting the risk on NVIDIA itself.
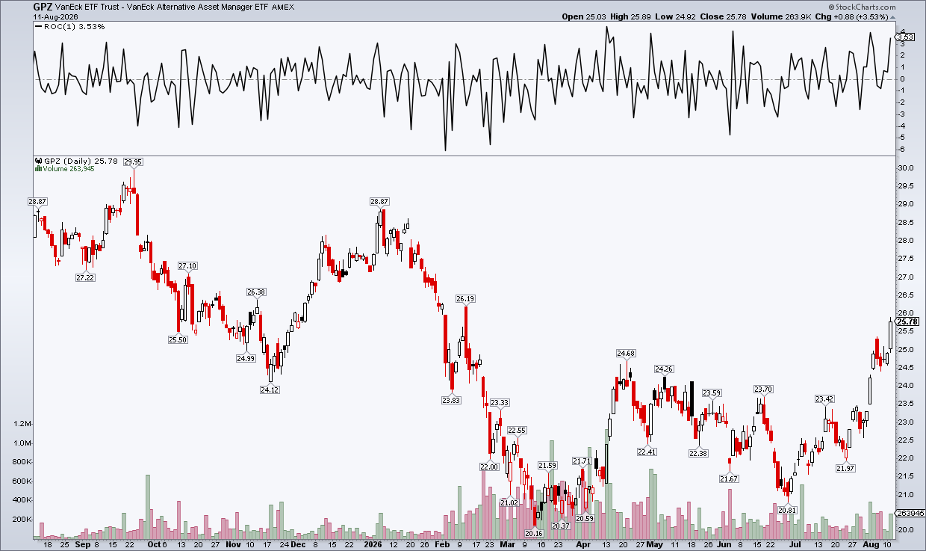
Investors like KKR, Apollo, Blackstone and Carlyle liked the plan. The little‑known VanEck Alternative Asset Manager Fund (GPZ) jumped 3.5 % and hit six‑month highs.
Strong Price Moves, but Is It Too Hot?
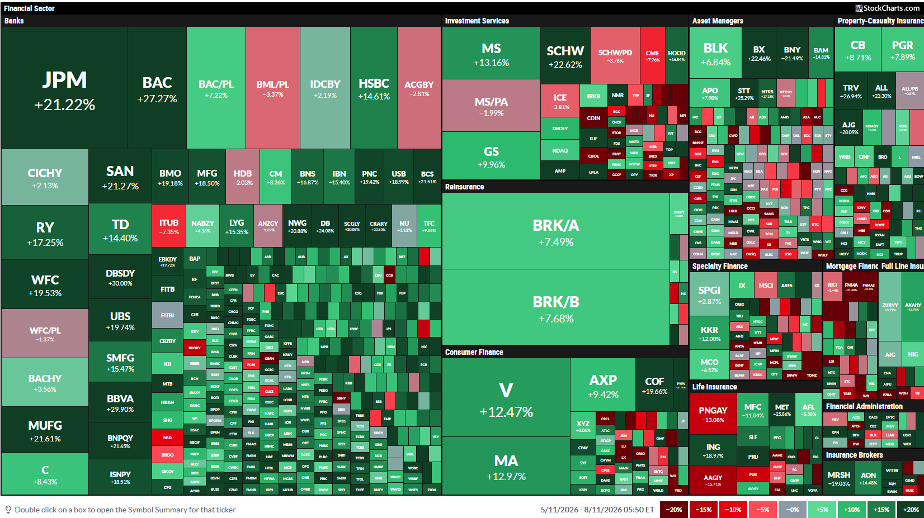
Even though some big managers are still below their yearly peaks, most of the financial heat map shows green. The question is whether eleven straight weeks of gains is too fast.
To answer that, we look at the Financial Select Sector SPDR ETF (XLF). It tells the story of the whole group.
XLF: New Records and Positive Signals
Since March 30, XLF is up about 20 %. It has made several record highs while tech and chip stocks sit lower. The key move was a breakout above the January high of $56.51, giving a price target near $66.
The 200‑day moving average is rising, meaning the long‑term trend is up. A “golden cross” appeared just before last month’s bank earnings, and the RSI sits in a bullish zone (60‑80).
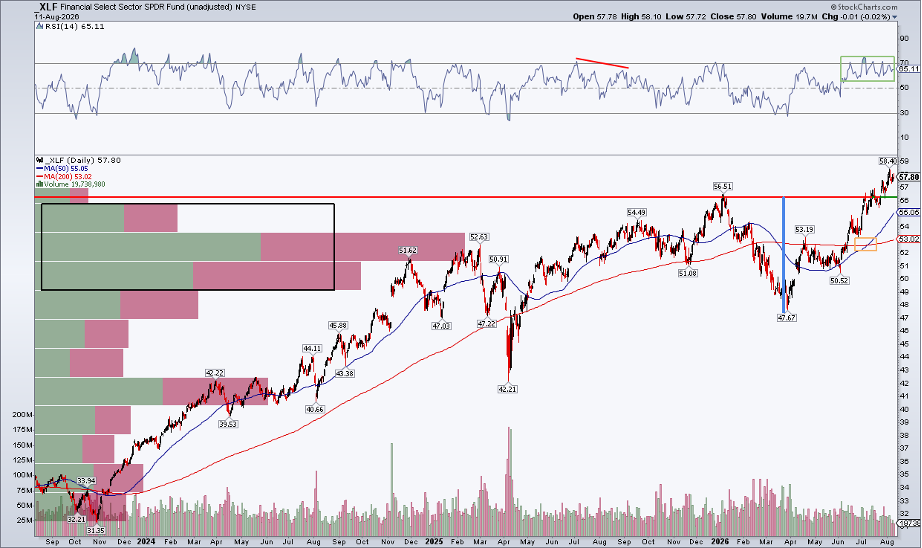
Trading volume started to rise around the mid‑$50s, giving the price strong support if it pulls back later in the year. The only small worry is that July‑August didn’t see huge volume, but that can happen in summer.
Seasonal Risks Are Small
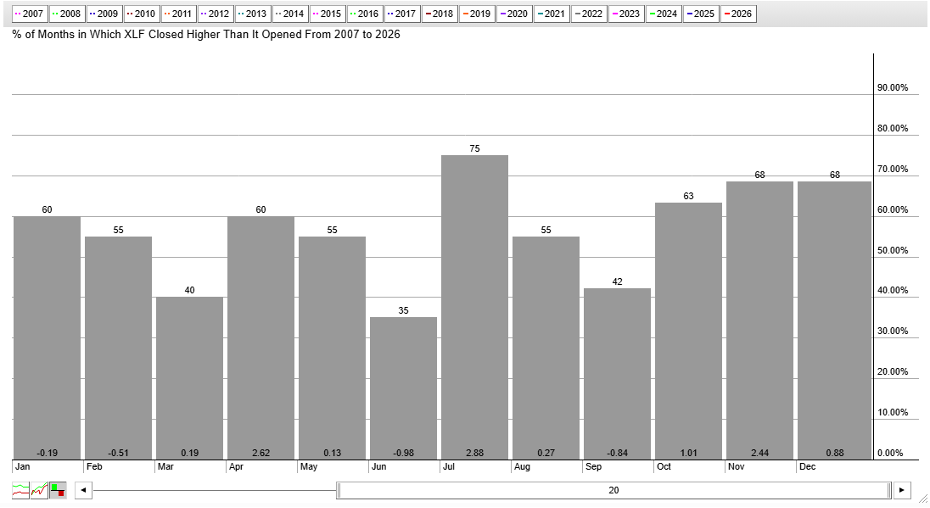
Historically, August gives a modest gain (about 0.27 %). September is weaker, with an average loss of 0.84 %, but XLF survived June’s dip. Historically, the fourth quarter often brings big jumps.
AI Growth Helps Banks
Higher global interest rates and strong borrowing demand from AI‑heavy companies give banks a boost. Both loan and equity markets are expanding, and bankers are ready to provide credit.
Relative Strength: XLF Leads the Pack
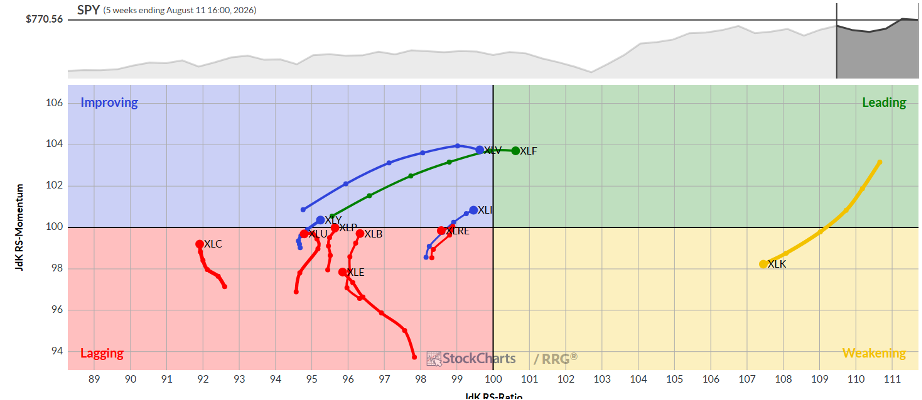
On a Relative Rotation Graph, XLF is the only S&P 500 sector ETF sitting in the green “Leading” zone. It recently moved right on the one‑year weekly view compared to the S&P 500 ETF (SPY), confirming its strong price performance.
Bottom Line
Financial stocks are firing on all cylinders, which is a good sign for the broader market. The recent rise in asset‑manager shares has added fuel to XLF’s summer surge. As long as there are no clear signs of exhaustion, the upward trend can keep going.
Disclaimer: This article is for educational purposes only and does not constitute financial advice. Always consider your own situation and consult a professional before acting.
Source: Materials provided by https://articles.stockcharts.com.Note: Content may be edited for style and length.