


When a price breaks out, it can sometimes pull back to the breakout level before moving higher again. This pull‑back is called a “throwback” and gives traders another chance to join the move. The VanEck Agribusiness ETF (ticker MOO) showed a clear throwback and then rose strongly.
MOO Ends Its Pull‑back and Moves Higher
Looking at a daily chart that covers the past year helps us see the big picture. MOO rose sharply from November to February, fell in June, and then jumped again in early July. The July jump marks the end of the down move and starts a new uptrend that could push the price about 25% higher in the months ahead.
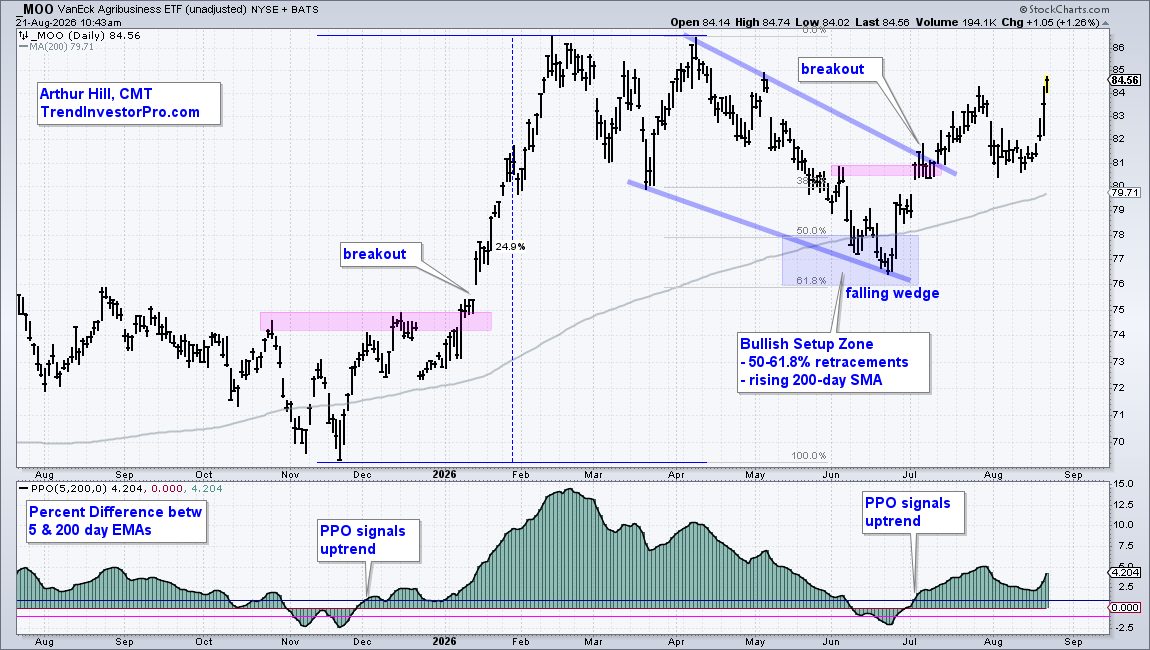
To confirm the trend, we use a Percentage Price Oscillator (PPO) with a 5‑day fast line and a 200‑day slow line. When the PPO moves above +1 %, it signals a bullish trend. In early July the PPO crossed that line, matching the price breakout.
Throwback Gives a Second Entry Point
A second chart shows the last seven months with daily candles. After a 10 % rise in late July, MOO fell back to the breakout zone around $80.5‑$81. This pull‑back is the throwback, offering traders a fresh entry.
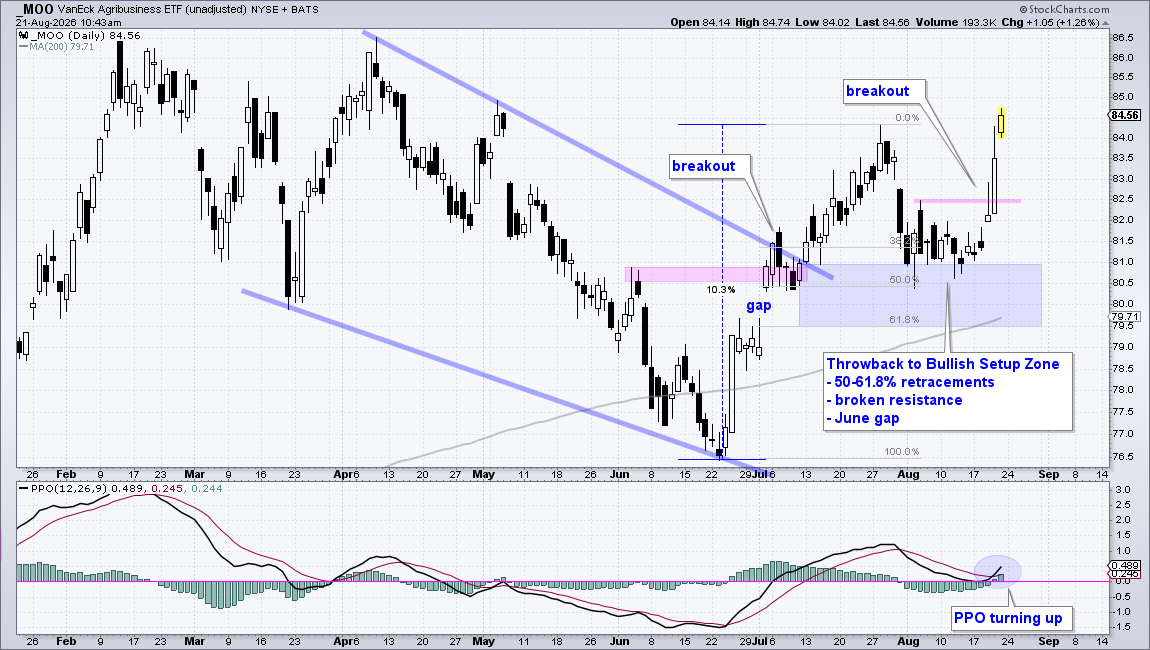
Several technical tools also point to support in that area: 50‑61.8 % Fibonacci retracements, a gap that opened on July 2, and the 200‑day simple moving average. MOO bounced off the top of this zone, stayed firm for two weeks, and then broke out again above $82.5. Both short‑term and long‑term signals now agree that the trend is up. If the price falls below $80, traders should rethink their plans.
Other ETFs that focus on artificial‑intelligence have shown similar throwbacks recently, and analysts are watching those zones for more upside.
Source: Materials provided by https://articles.stockcharts.com.Note: Content may be edited for style and length.