
Before we start…
The results you get from a stock screener depend on the filters you choose. Simple filters give simple results. Unique filter mixes can reveal hidden opportunities. StockCharts’ Screener offers many technical and fundamental options that most free tools lack.
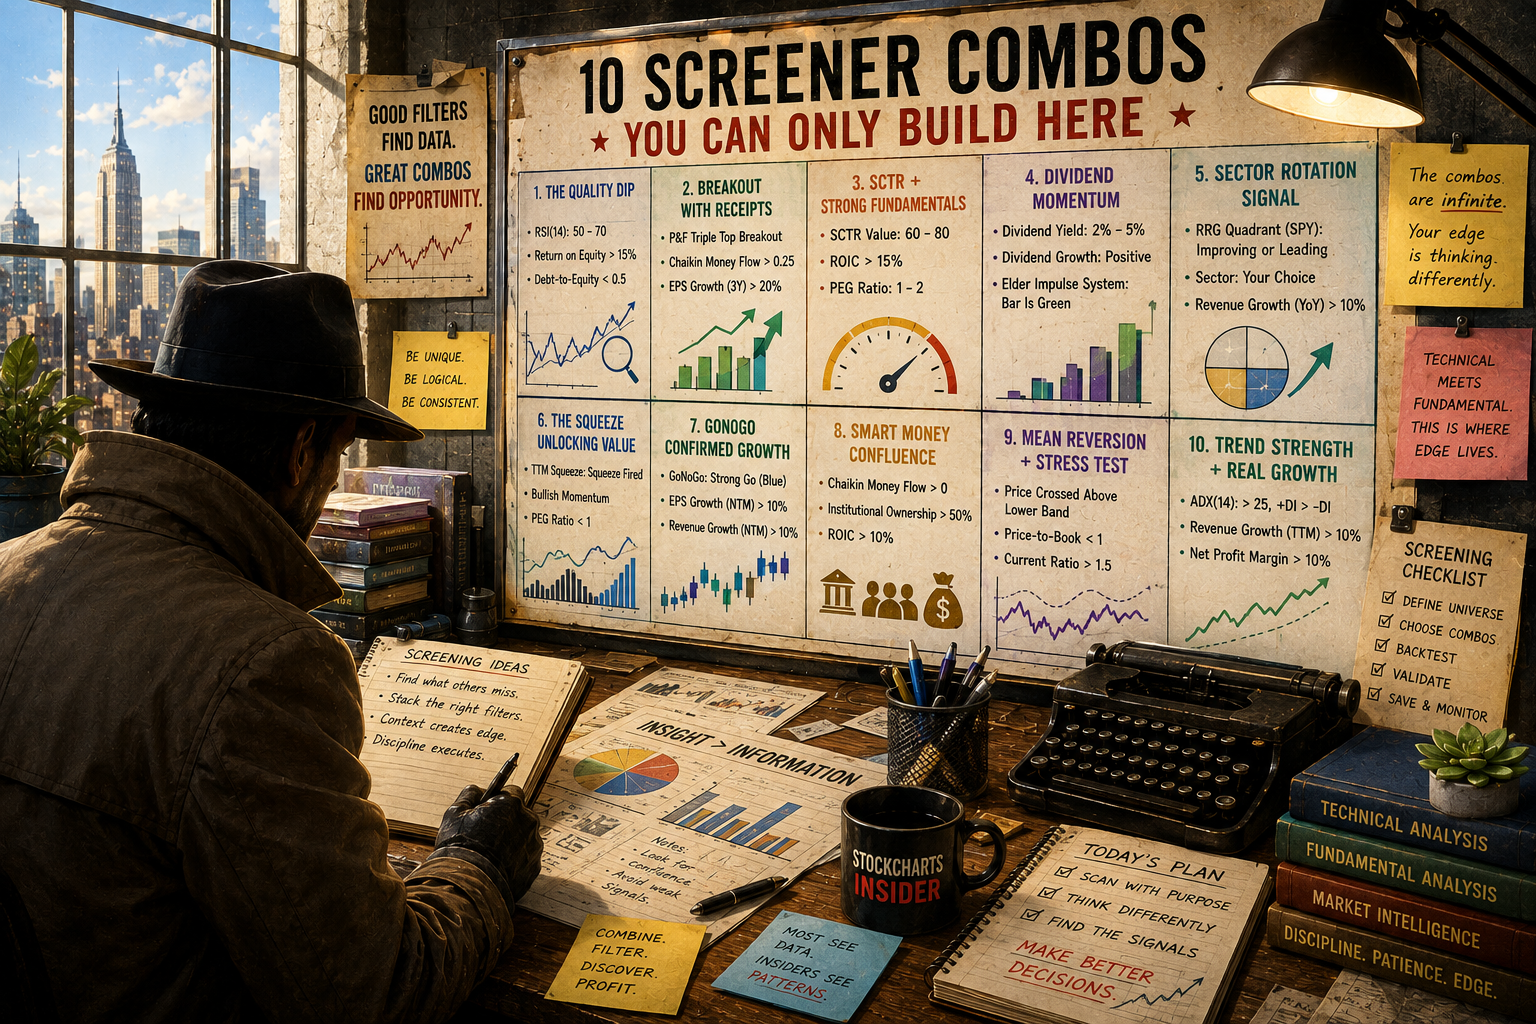
In the last article we learned that the screener has six groups and 99 filters, which means almost endless combinations. The hard part is picking the right mix. Below are ten fairly original combos to spark your imagination. Feel free to copy, change, or create new ones.
Why Mixing Filters Works Better
A single filter tells a tiny story. For example, an RSI below 30 only hints that a stock may be oversold. A low P/E only suggests it might be cheap. When you combine several filters, you get a fuller picture. With six groups and 99 filters you have the raw ingredients; your creativity does the cooking.
Remember to first select a security category in the “Groups” panel – this tells the screener where to look (stock type, country, exchange, sector, etc.). After that, add your filters to narrow the list.
#1 – Quality Dip
RSI (14) between 50‑70, ROE > 15 %, Debt‑to‑Equity < 0.5
An RSI in the 50‑70 range shows mild bullish momentum. Pair it with solid return on equity and low debt, and you may spot a strong company that is temporarily pulling back.
#2 – Breakout With Confirmation
Point‑and‑Figure Triple‑Top breakout, Chaikin Money Flow > 0.25, EPS growth (3‑yr) > 20 %
This mix looks for a breakout on a point‑and‑figure chart, confirms buying pressure with Chaikin Money Flow, and requires the company to have grown earnings strongly over the past three years.
#3 – SCTR + Strong Fundamentals
SCTR value 60‑80, ROIC > 15 %, PEG ratio 1‑2
SCTR blends price strength across timeframes. A score between 60 and 80 signals early optimism. Adding high return on invested capital and a reasonable PEG ties technical strength to solid fundamentals.
#4 – Dividend Momentum
Dividend yield 2‑5 %, dividend growth > 0, Elder Impulse green bar
Yield alone can be a trap. This screen demands rising dividends and a green Elder Impulse bar, which together show a company that pays well and is still gaining price strength.
#5 – Sector Rotation Signal
RRG quadrant improving or leading vs. SPY, chosen sector, revenue growth YoY > 10 %
Relative‑strength graphs (RRG) reveal where money is flowing. Adding a sector filter and a revenue‑growth requirement helps you pick stocks that are both in a hot sector and growing their sales.
#6 – The Squeeze Unlock
TTM squeeze fired, bullish momentum, PEG < 1
A fired TTM squeeze means volatility has broken to the upside. Pair it with bullish momentum and a PEG under 1 to find a stock that may be undervalued relative to its growth.
#7 – Go/No‑Go Confirmed Growth
Go/No‑Go strong go (blue), EPS growth NTM > 10 %, revenue growth NTM > 10 %
This screen uses a forward‑looking “go” signal together with projected earnings‑per‑share and revenue growth for the next twelve months, giving you a technical‑fundamental combo that looks ahead.
#8 – Smart‑Money Confluence
Chaikin Money Flow > 0, institutional ownership > 50 %, ROIC > 10 %
Three separate signs of smart money: buying pressure from Chaikin, more than half the shares held by institutions, and a company that uses capital efficiently. When all three line up, the story looks promising.
#9 – Mean‑Reversion with Balance‑Sheet Test
Price crossed above lower Bollinger band, price‑to‑book < 1, current ratio > 1.5
Buying a dip can be risky. This mix looks for a price that has just moved above the lower Bollinger band (a classic mean‑reversion cue) while also demanding a low price‑to‑book ratio and a healthy current ratio for safety.
#10 – Trend Strength With Real Growth
ADX > 25 with +DI > ‑DI, TTM revenue growth > 10 %, net profit margin > 10 %
ADX above 25 signals a strong trend. Adding a positive directional indicator (+DI) ensures the trend is upward. Pair it with solid revenue growth and double‑digit profit margins for a well‑rounded pick.
These Ten Are Just the Beginning
Six groups and 99 filters give you millions of possible screens. Swap any filter for a neighbor and you get a brand‑new combo. Your imagination is the only limit.
Try these ideas, tweak them, and create your own. Find the mixes that most investors overlook, and you’ll start thinking like a StockCharts Insider.
That’s All for Now
Remember, no single tool can replace both technical and fundamental analysis. The power of this screener lies in mixing the two. Now it’s up to you to build the screens that work for you.
Source: Materials provided by https://articles.stockcharts.com.Note: Content may be edited for style and length.