
The Federal Reserve has hinted it might raise rates once or twice more before the year ends if the economy allows. Some people think the Fed is just trying to scare inflation expectations. But as long as commodity prices stay steady, the numbers we see now point toward higher rates.
2‑Year Yield Leads the Funds Rate
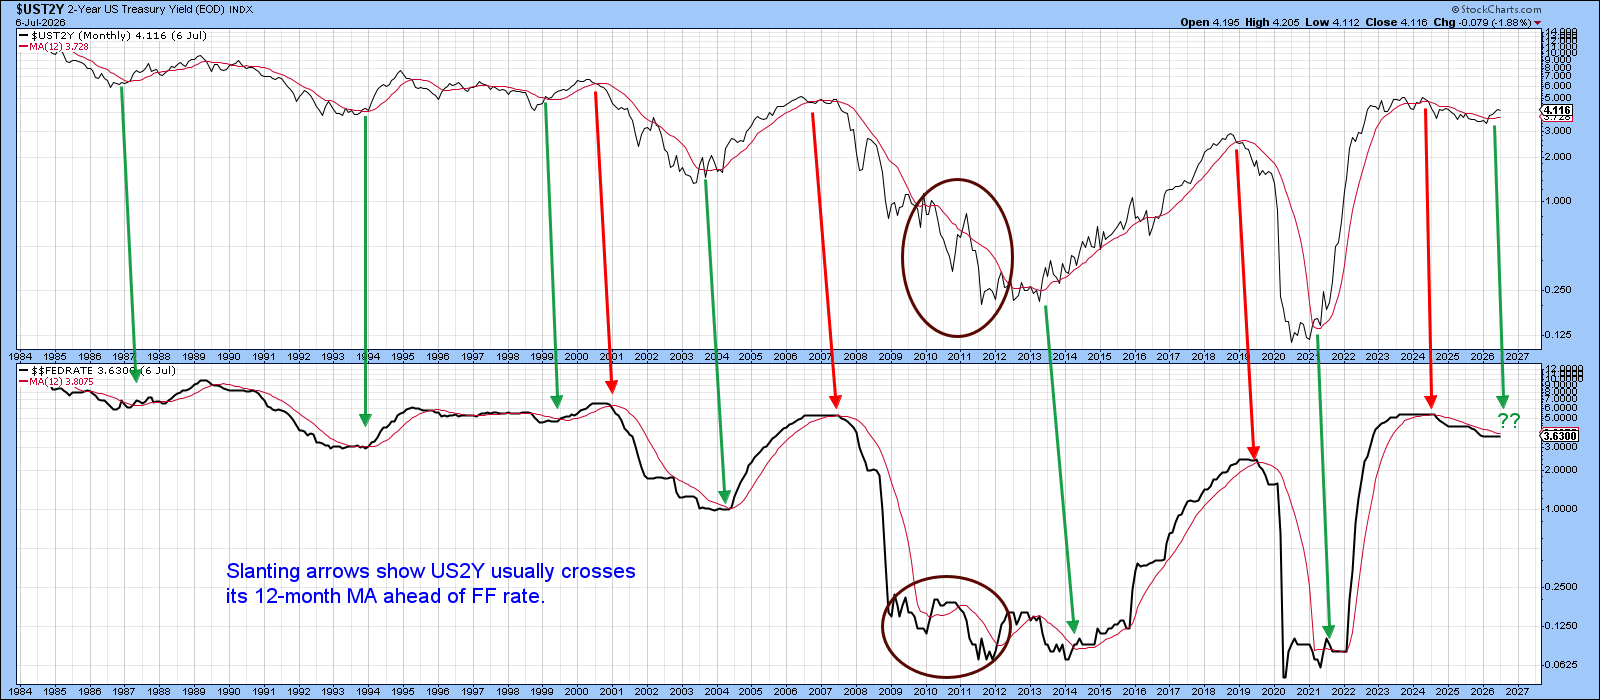
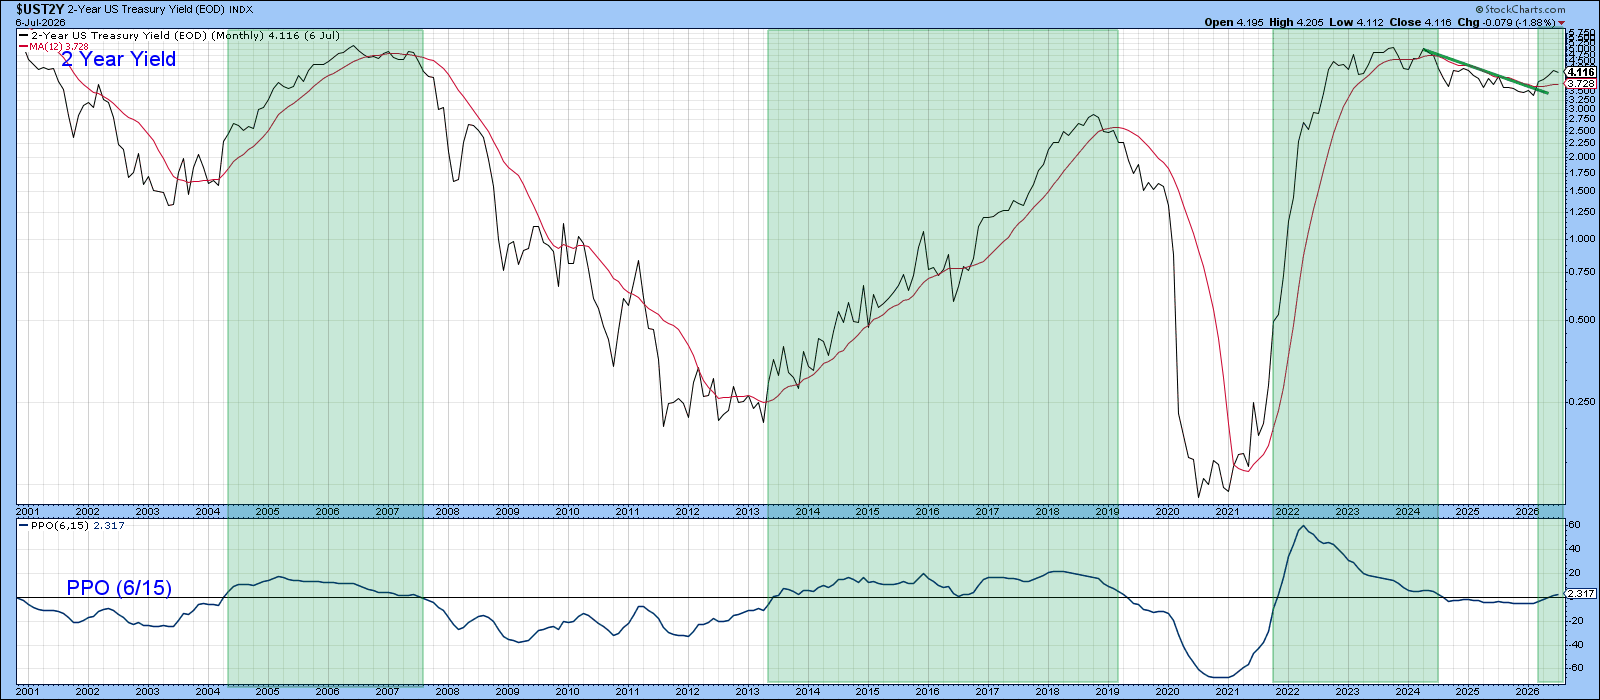
The 2‑year Treasury yield often changes before the Fed funds rate does. When the 2‑year line crosses its 12‑month moving average, it can signal the start of a new rate‑hiking cycle.
Inflation Pressures on Short‑Term Rates
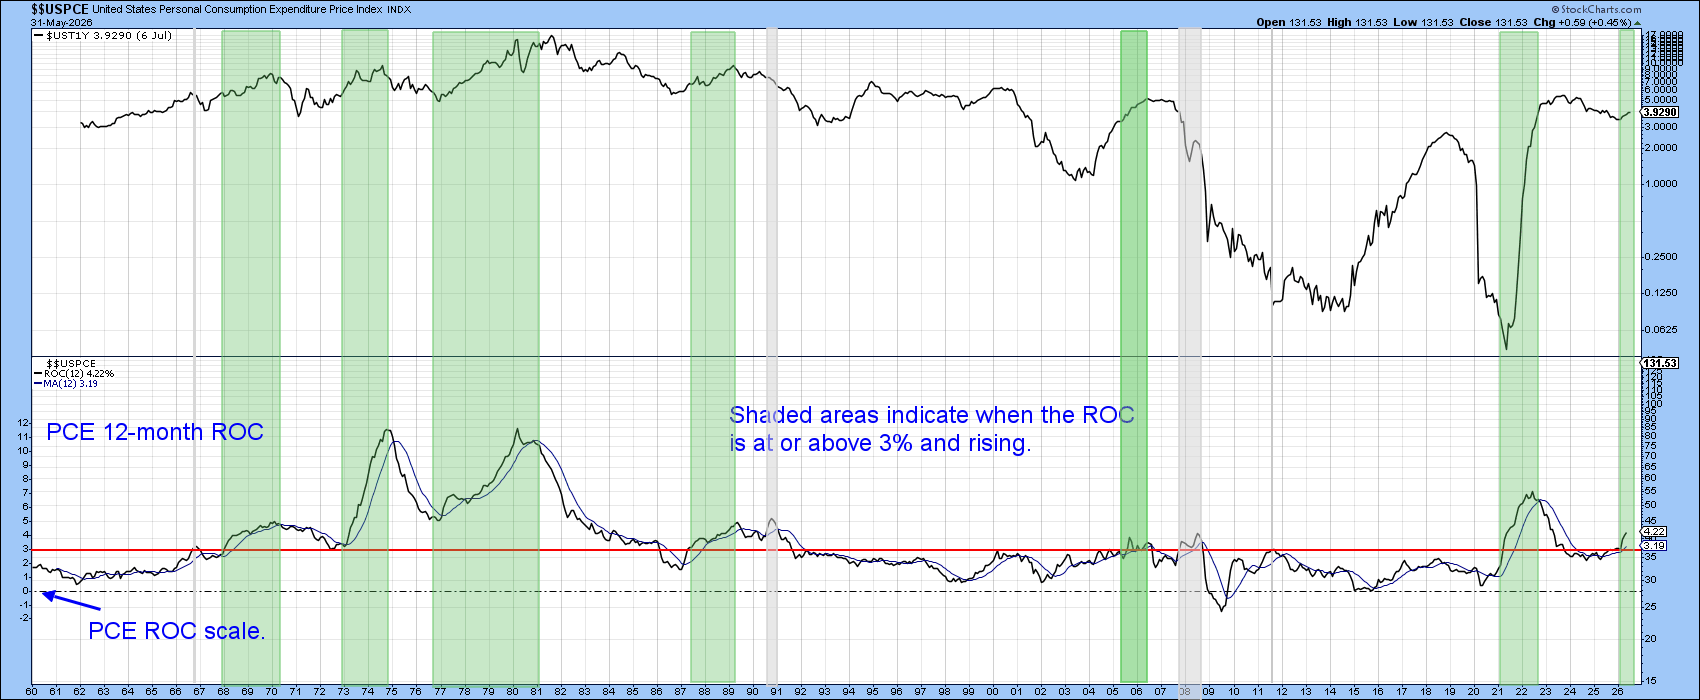
When the Personal Consumption Expenditures (PCE) price index rises above 3% and its 12‑month average, short‑term rates have usually gone up. The latest PCE numbers are well over those levels, which historically pushes rates higher.
How Inflation Moves Through the Economy
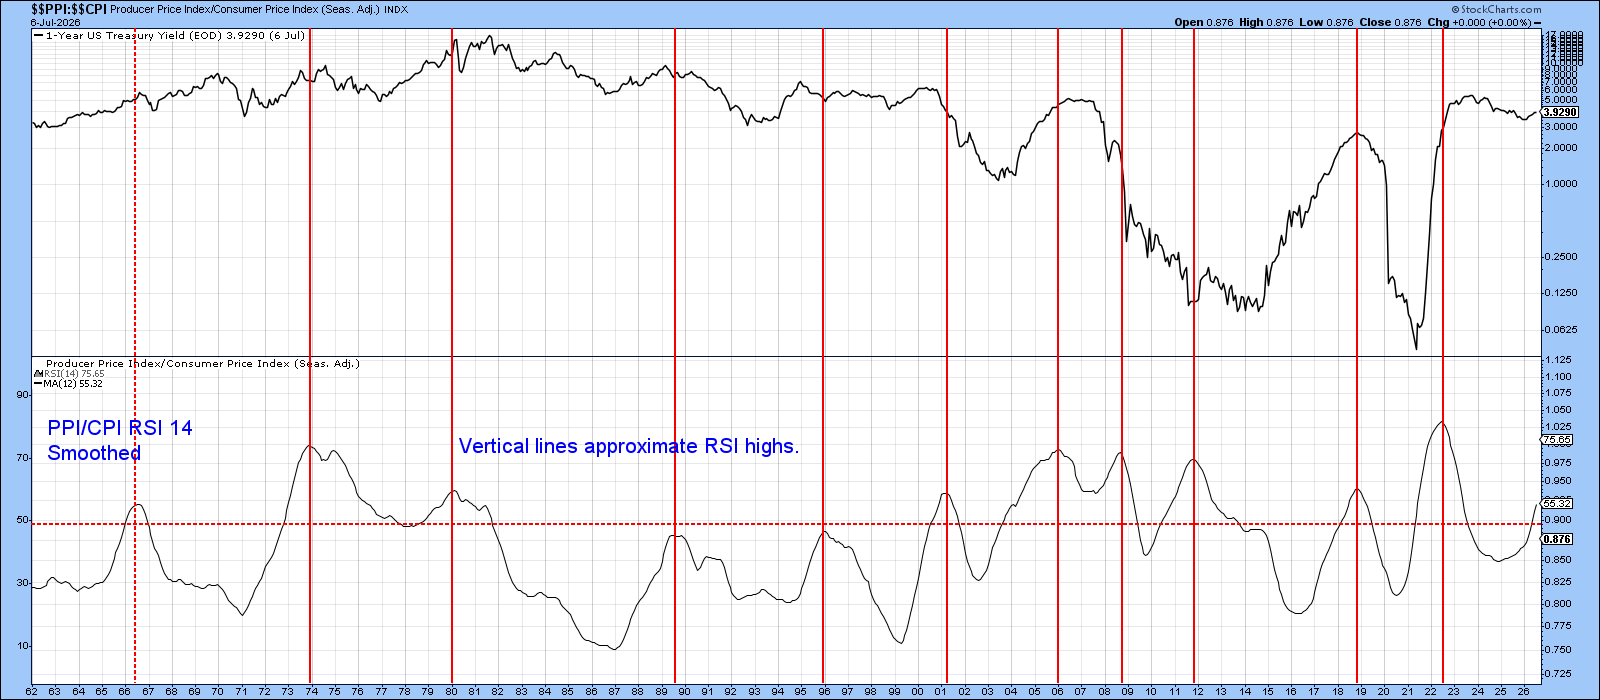
Price pressure usually starts with commodities, moves to producer prices, and finally reaches consumers. This lag can be seen by comparing the 1‑year Treasury yield with a ratio of consumer‑price (CPI) to producer‑price (PPI) indexes.
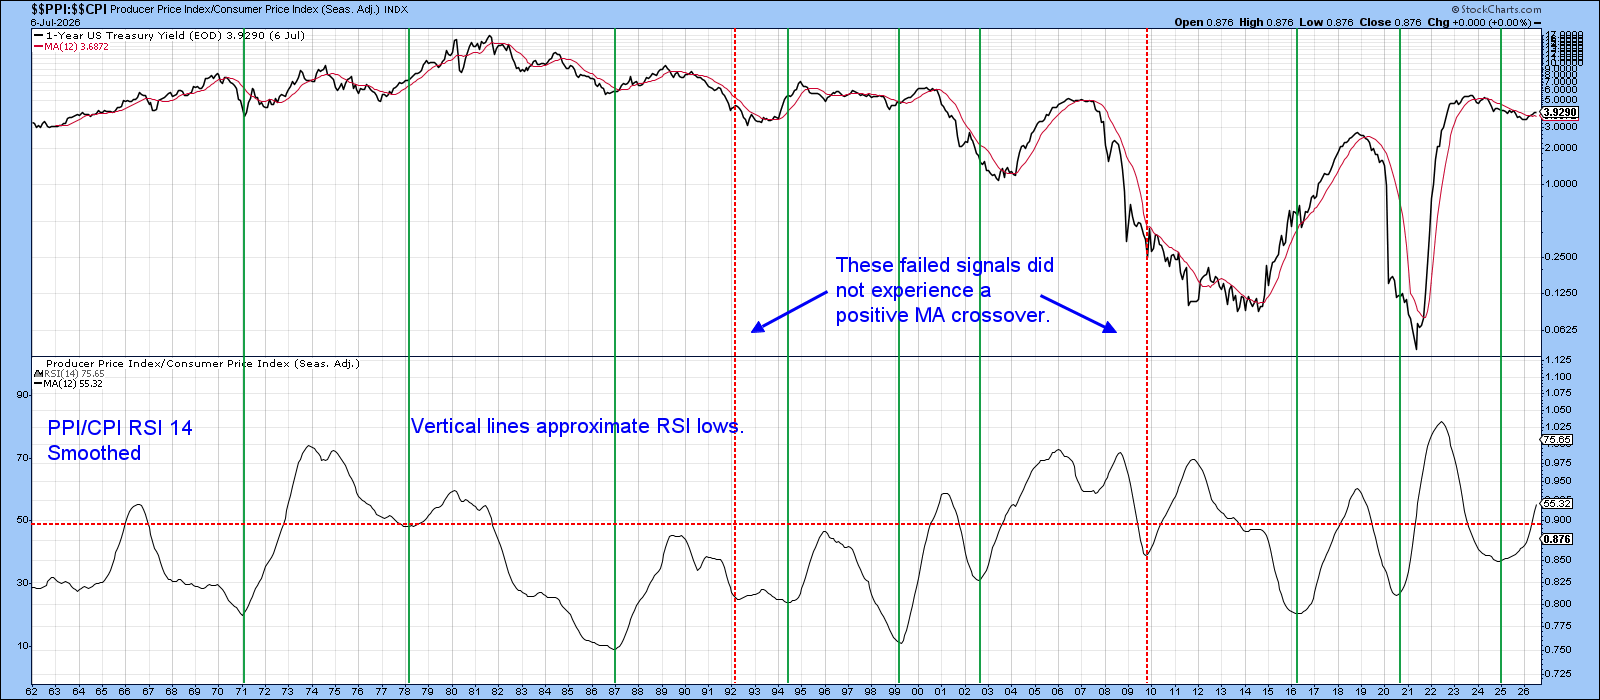
When the ratio’s RSI moves up from a low point, it shows that inflation is gaining momentum, and the bond market starts pricing in higher rates.
Technical Signal for Rate Trends
A technical tool called the Percentage Price Oscillator (PPO) can show when the 2‑year yield is turning upward. When the PPO line crosses above zero, it often means rates will keep climbing.
Bottom Line
All of the charts point to a higher‑rate environment for now. Until inflation shows a clear slowdown, short‑term interest rates are likely to stay on the rise.
Source: Materials provided by https://articles.stockcharts.com.Note: Content may be edited for style and length.