

This week many big growth stocks fell sharply. Investors wonder if this is a short pull‑back or the start of a larger drop.
We will look at a pattern called “moving average limbo.” It helps show where a stock might go next. I’ll explain the idea and give three real examples.
Why Falling Below the 200‑Day Average Matters
When a stock is in a strong uptrend it stays above three moving averages that rise together. This order shows healthy buying pressure.
Alphabet (GOOGL) was following this rule after its March low, but in early June it slipped lower, hinting a pull‑back.
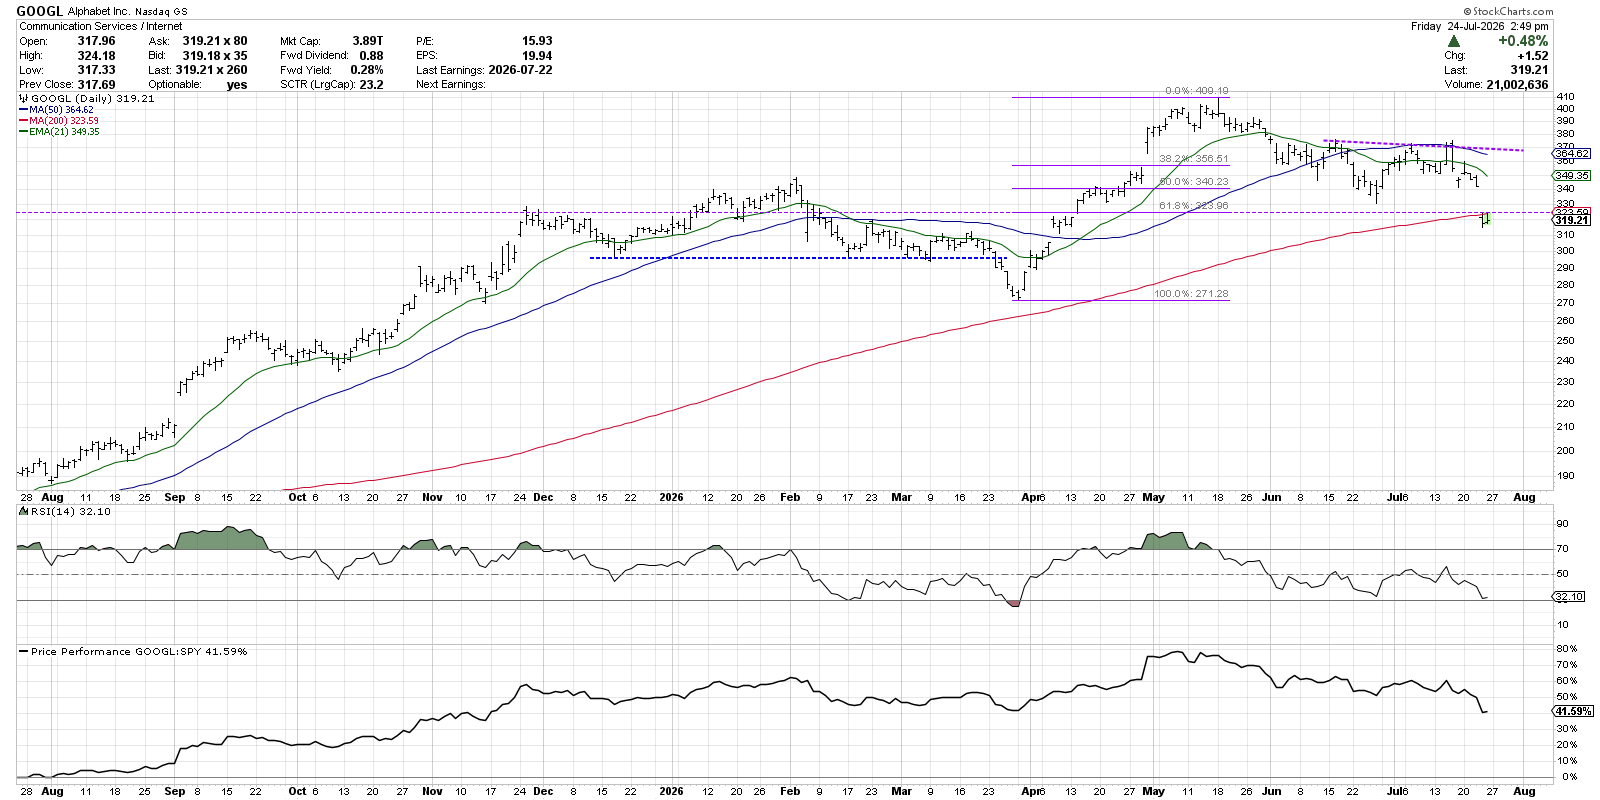
When GOOGL dropped under the 21‑day EMA and the 50‑day SMA, it entered limbo – still above the 200‑day line but below the 50‑day line. A break above $370 would have signaled the pattern ending upward.
Instead, the stock opened lower after a weak earnings report, closing the pattern to the downside. If it can climb back above the 200‑day average, the clock may reset and a move above the 50‑day line could restart the uptrend.
Limbo Can End With a Bullish Break
The S&P 500 Mid‑Cap 400 ETF (MDY) shows how the pattern can finish with a rise.
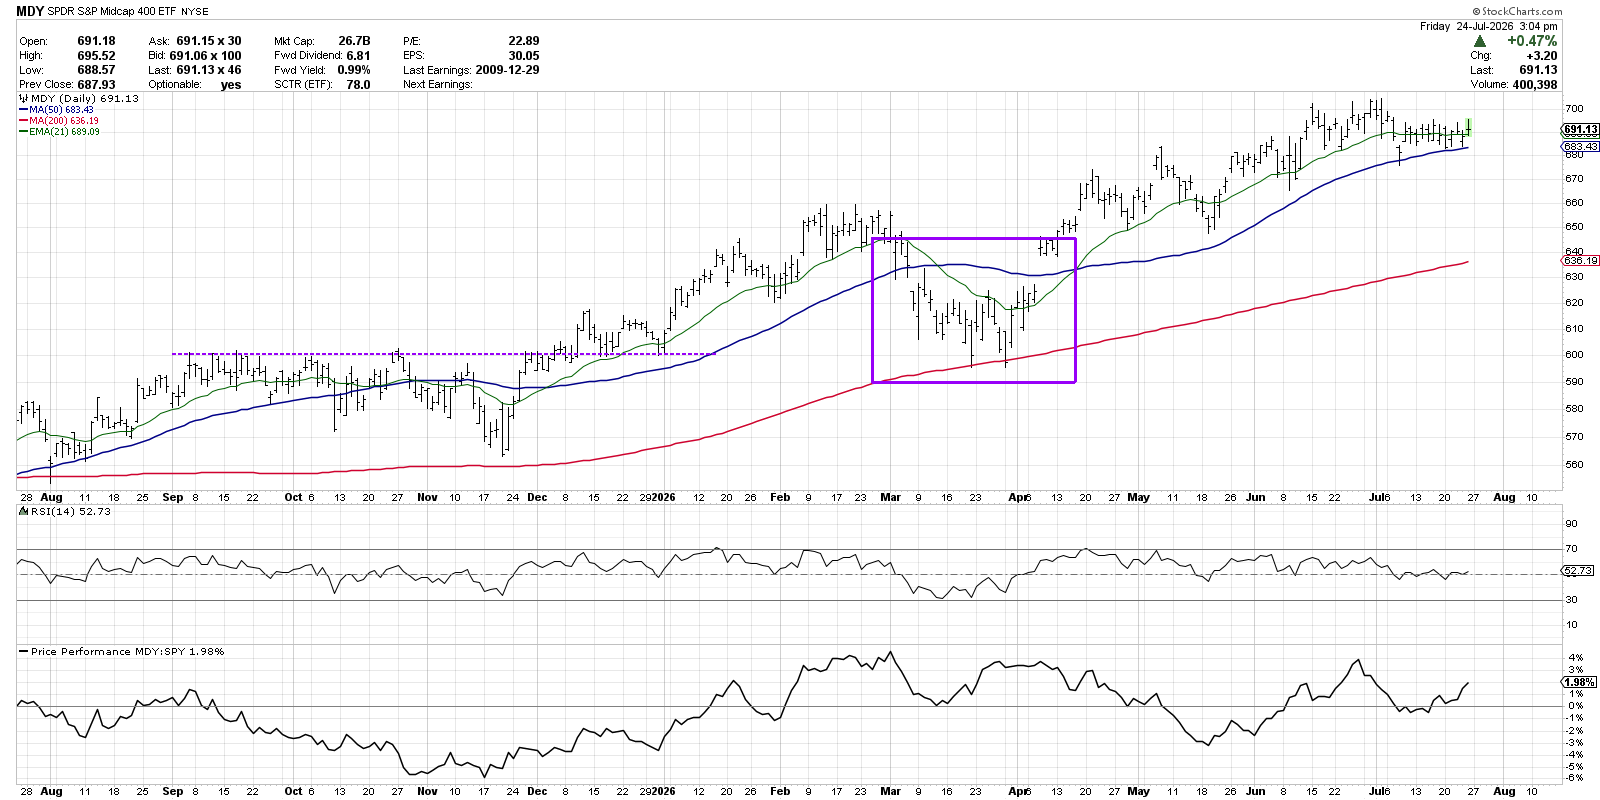
MDY fell to its March low, tested the 200‑day line several times, and then jumped above the 50‑day SMA. That gap suggested new buying interest and a strong chance for more upside.
In an uptrend, the 21‑day EMA and 50‑day SMA act like early support. As long as the 200‑day average stays intact, a rise above the 50‑day line often clears the way for further gains.
Tech Weakness Can Spread Quickly
Tech stocks can pull the whole market down. While Alphabet already fell, Broadcom (AVGO) is still sitting in limbo.
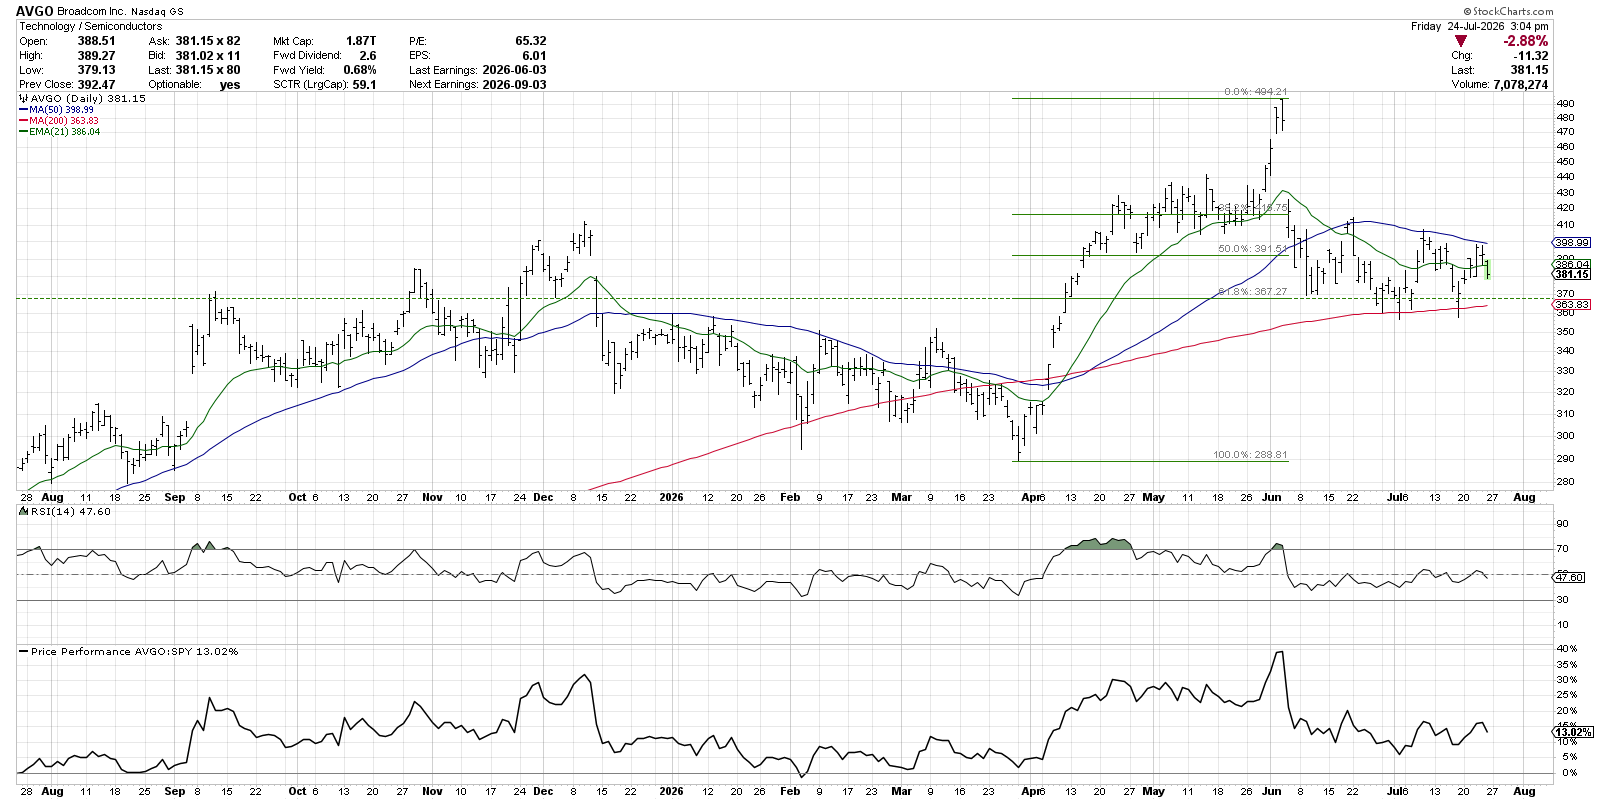
Will AVGO break up like MDY or down like GOOGL? The limbo pattern alone does not tell us the direction, but it does give a clear framework for risk and reward. Traders can set alerts at the key moving‑average levels and plan their next steps with confidence.
Disclaimer: This material is for educational purposes only and does not constitute financial advice. Always consider your own situation and consult a professional before acting.
Source: Materials provided by https://articles.stockcharts.com.Note: Content may be edited for style and length.