
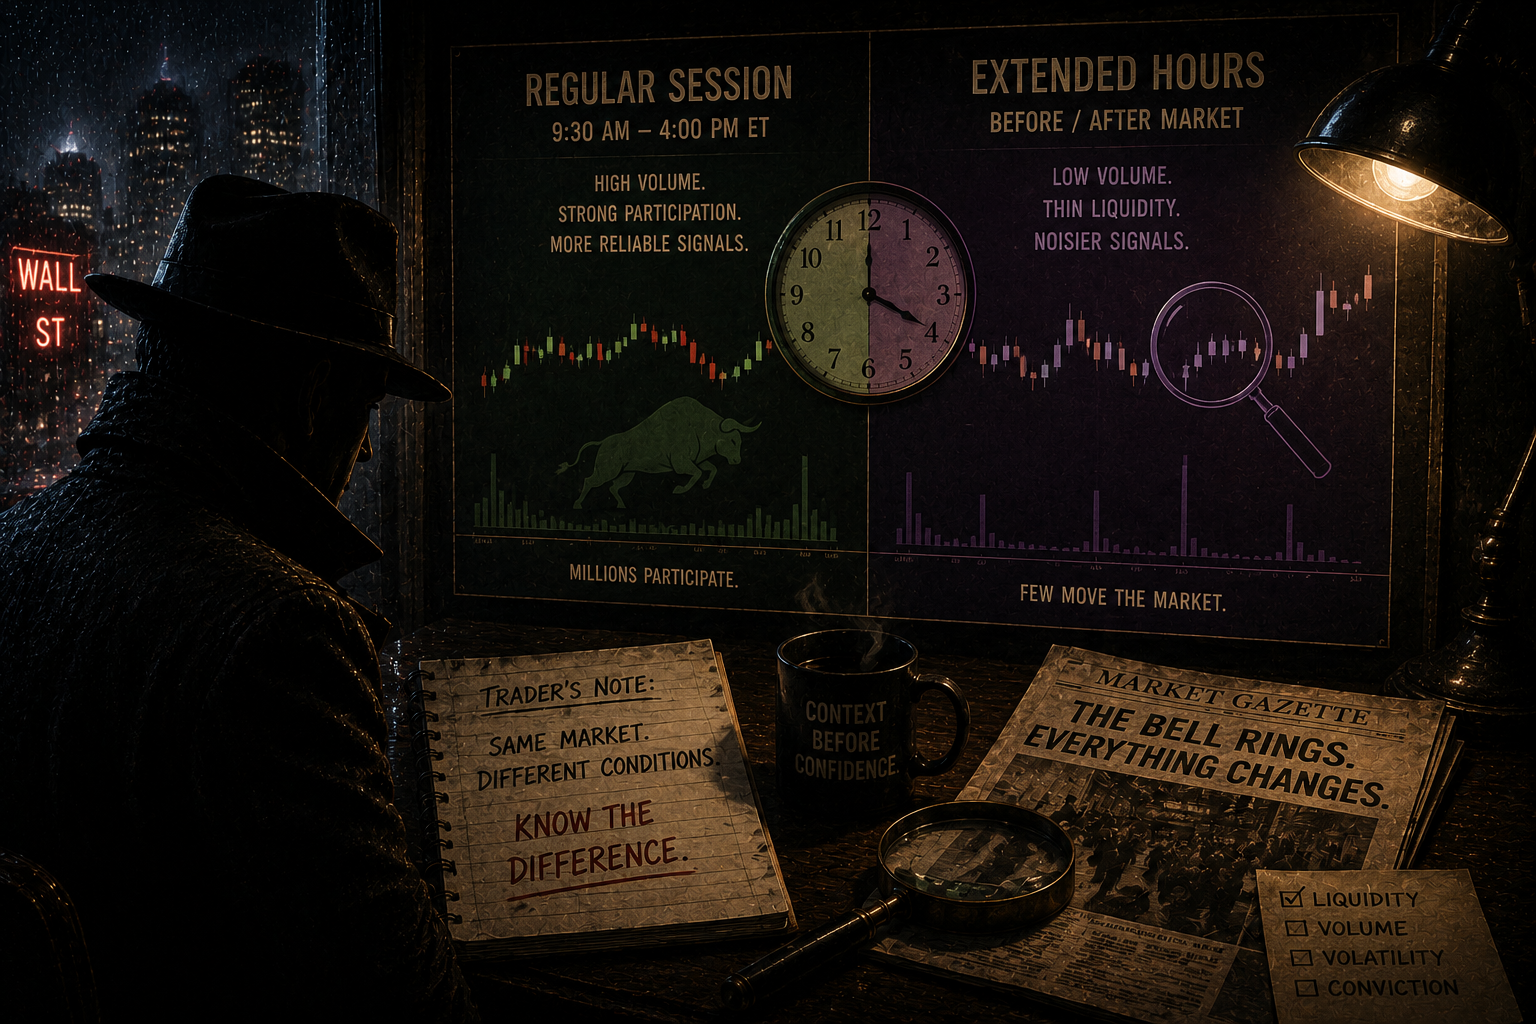
First, a quick note…
Indicators need data – price and volume – to work. When the market is open after hours, volume drops a lot. Less trading means the numbers can look odd. Momentum can look bigger and trends can change.
So the math still runs, but it runs on different inputs. What does this mean for an intraday chart? Let’s find out.
Adding After‑Hours Bars Changes the Whole Picture
In SharpCharts or StockCharts, tick a box called “Extended Hours”. The chart then shows a purple shade for after‑hours and a green shade for pre‑market.
Now you see more bars, but they are not the same as regular‑session bars. Fewer traders are active, so the price moves on smaller trades. This thin activity can bend the calculations of most indicators.
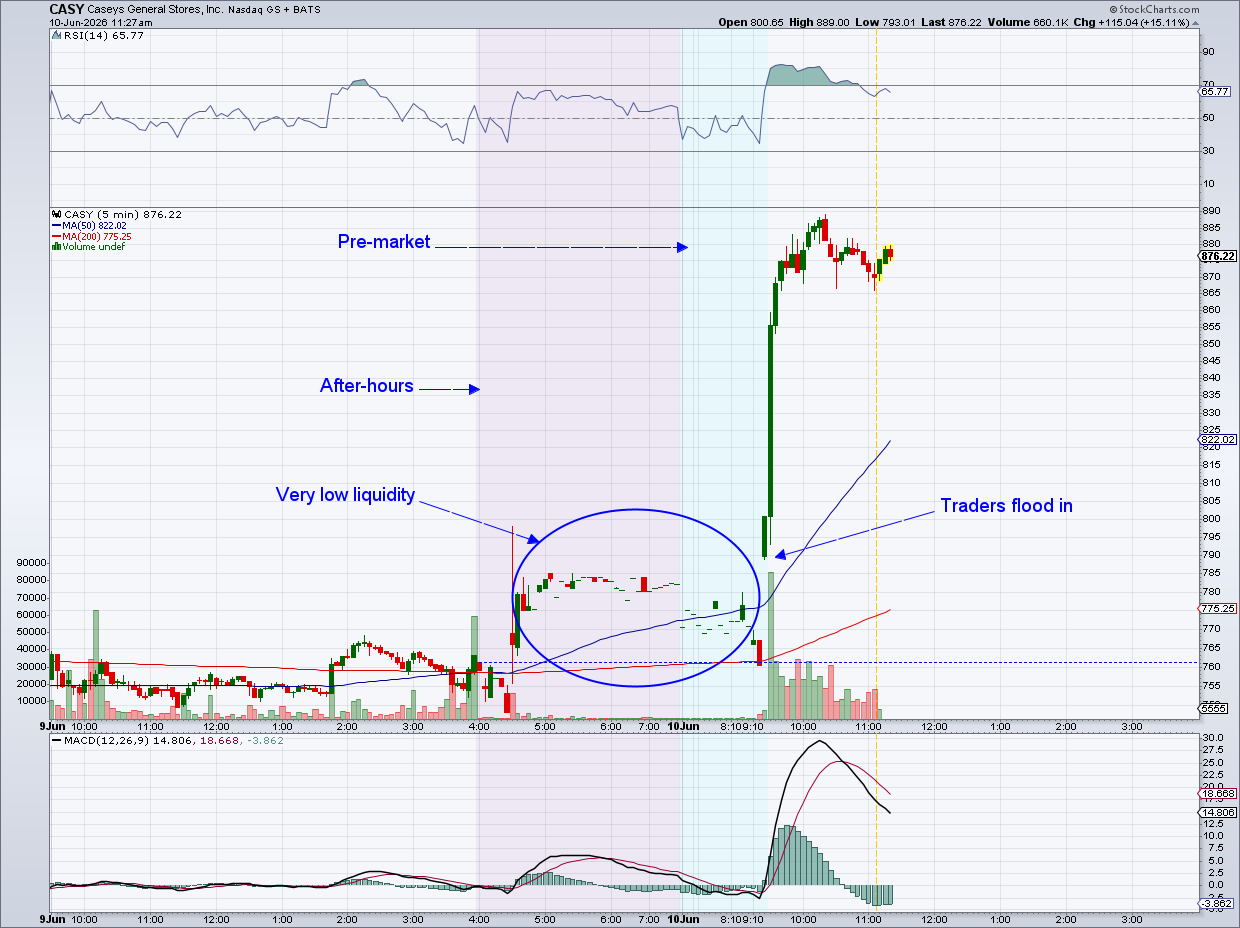
Breakouts can look huge in after‑hours, but remember who is trading. Usually only big institutions or automated news bots are left. Their trades can push the price a lot, making the chart look volatile.
Common tools like the Relative Strength Index (RSI) or Moving Average Convergence/Divergence (MACD) normally read the actions of millions. In the quiet hours they may be reacting to just a few large players.
What We Know for Sure
- No volume data is recorded for after‑hours bars. Any indicator that needs volume (VWAP, OBV, CMF) can’t work correctly.
- Liquidity drops a lot. Thin trading creates shaky price bars and unpredictable moves.
- Indicators use closing prices. When those closes come from thin bars, the math works on noisy data, so the output is less reliable.
Look at the Robinhood (HOOD) chart below. You’ll see the volume‑based tools are frozen.
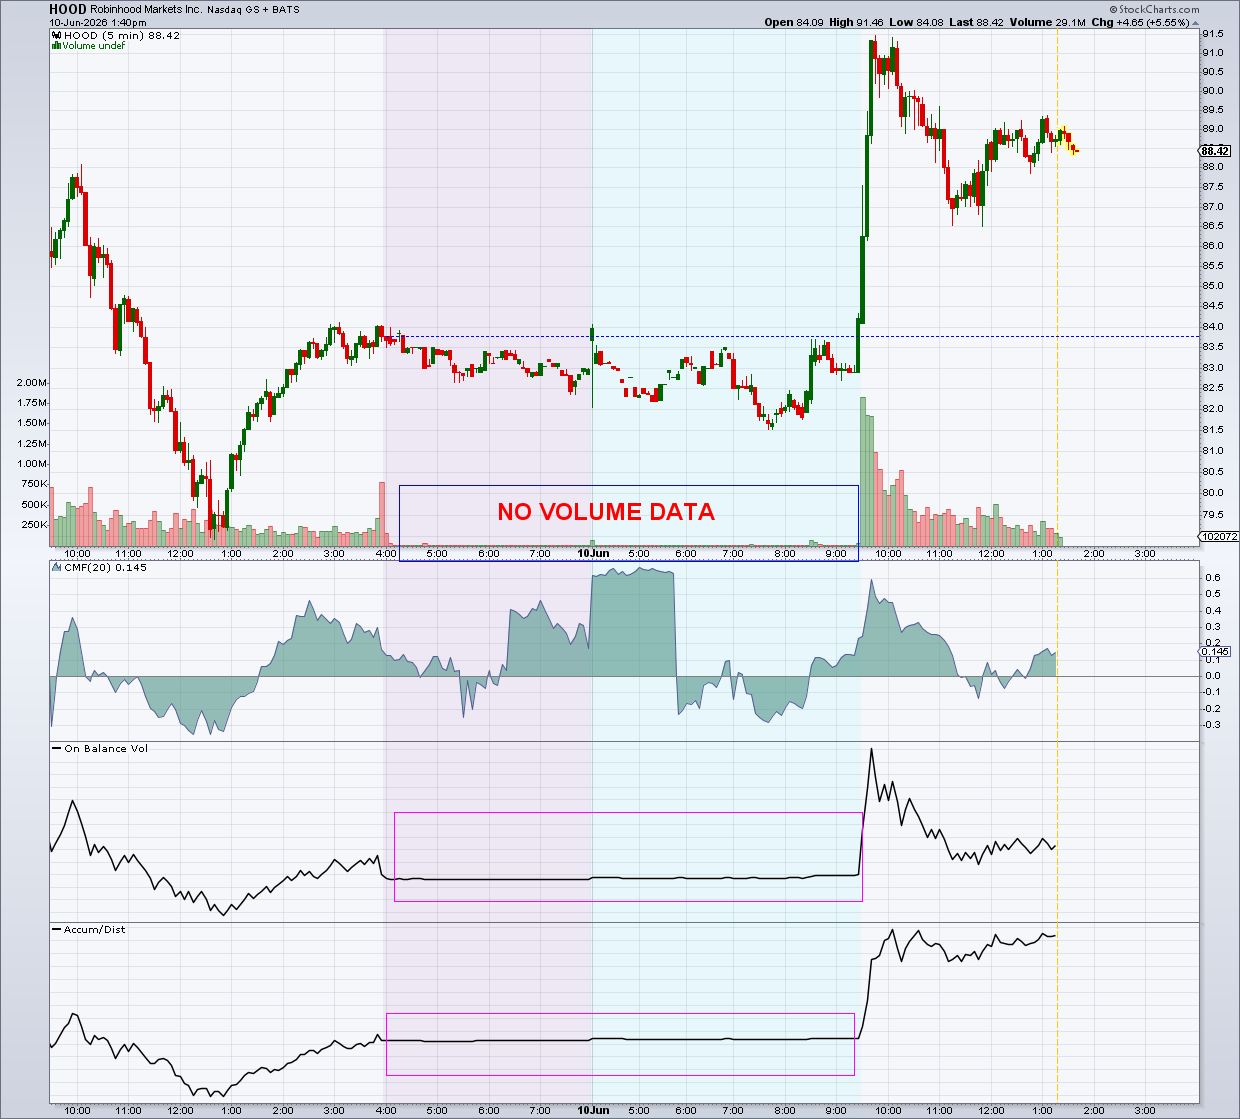
Because there is no volume, the Chaikin Money Flow (CMF) still shows a line, but its meaning is doubtful. OBV and the Accumulation/Distribution line stay flat – they have nothing to read.
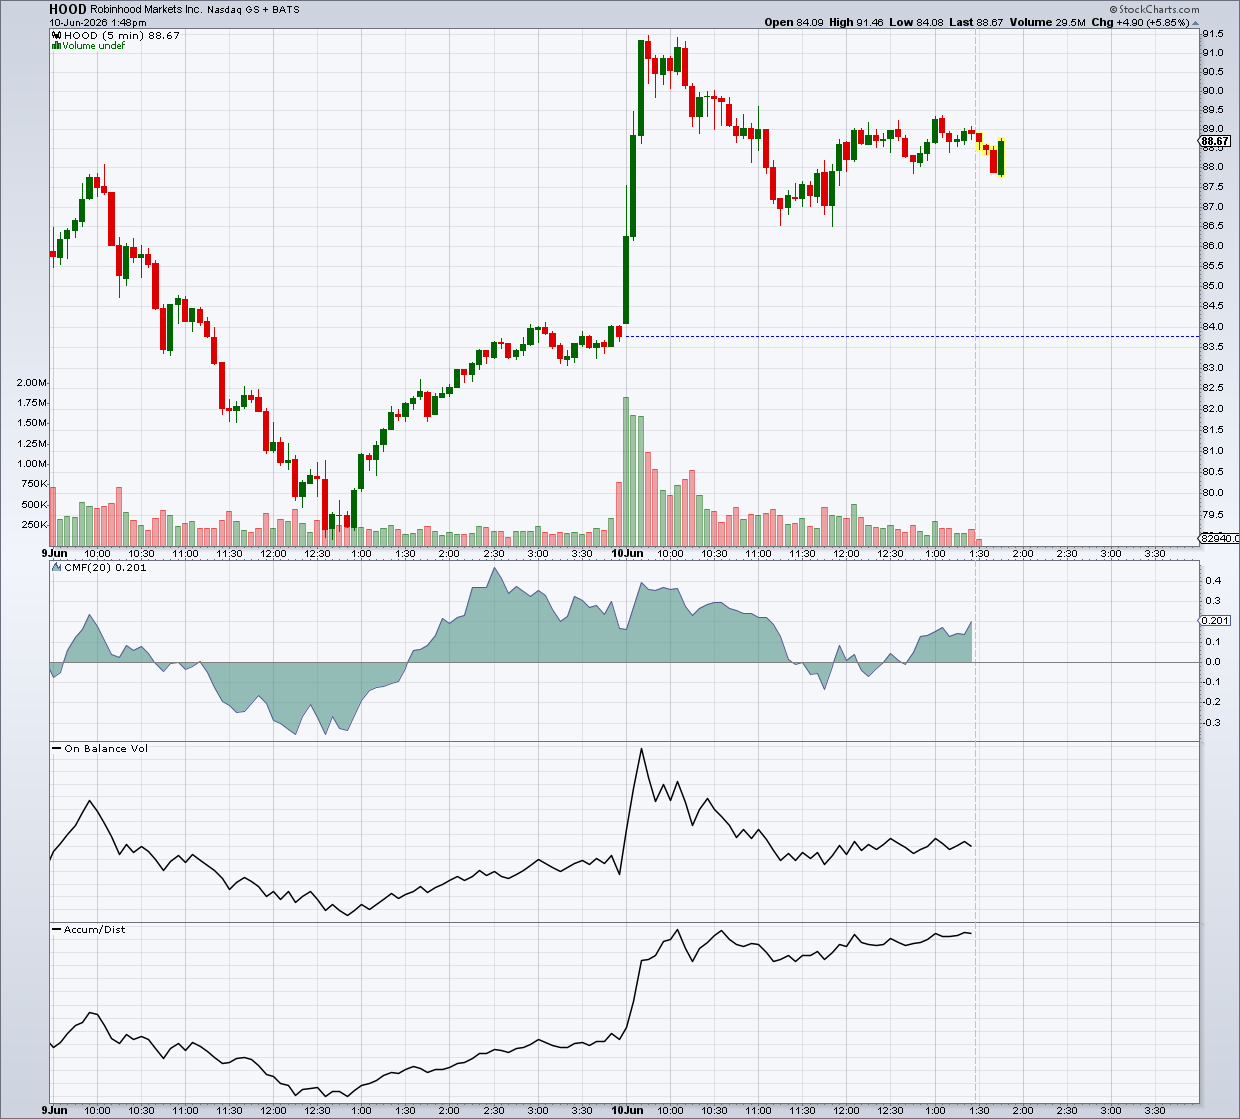
The regular‑session view looks smoother. The same indicators are easier to read because they have real volume behind each bar.
Were These Indicators Made for Intraday Charts?
Traders love tools like RSI, MACD and the Stochastic Oscillator. They work on any time frame, but they were not originally built for five‑minute bars. Experienced day‑traders know that after‑hours data behaves differently, so they treat those periods with extra caution.
Quick Reference: How Common Indicators React to After‑Hours
| Indicator | After‑Hours Effect | Tip |
|---|---|---|
| RSI | Distorted by thin trades | Use carefully |
| MACD | EMA can be skewed | Good for context, but not for precise signals |
| Stochastic | Same thin‑trade problem | Rely on regular session instead |
| CMF | No volume, so it may mislead | Double‑check before trusting |
| OBV | Volume missing | Avoid using |
| Moving Averages | More data points, but quality is low | Depends on your strategy |
| Bollinger Bands | Volatility looks bigger | Watch out for false squeeze signals |
| ATR | Shows noisy range | Can be useful for overnight range |
Support and Resistance Hold Up Better
Pure price levels—support and resistance—are less affected by missing volume. They simply mark where price stopped or turned.
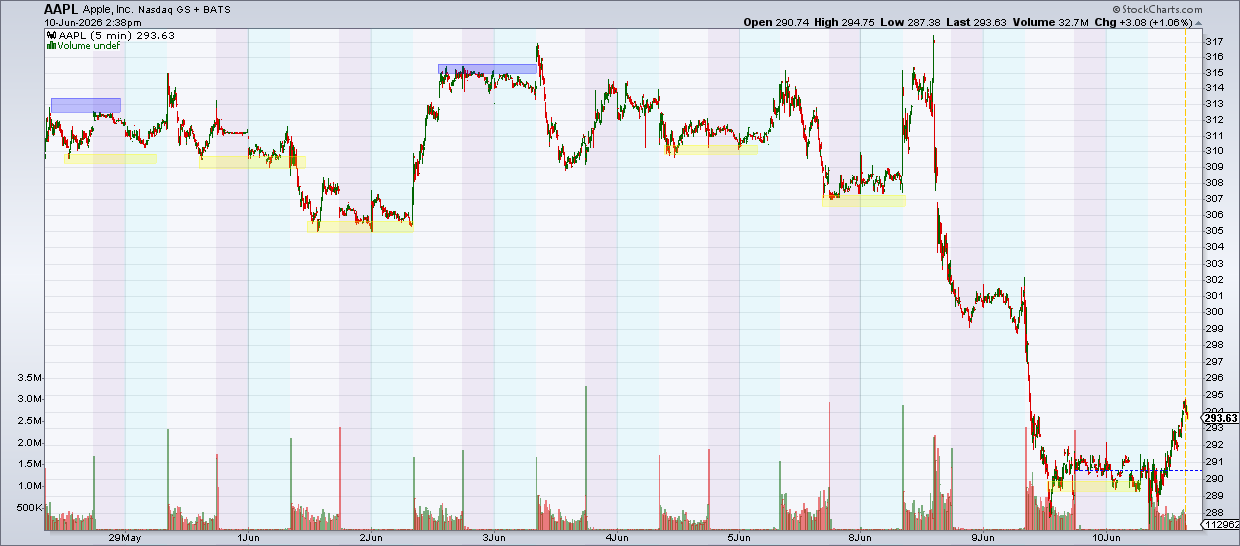
Even in thin trading, price often respects the same support and resistance lines that were set during regular hours. If the price breaks those levels, it usually triggers a reaction when the market opens fully.
Final Thoughts
Trading after the bell gives you a peek at early moves, but the market is quieter and easier to swing. Indicators still calculate, yet they are fed with noisy data. Treat after‑hours readings as a hint, not a guarantee, and be ready for a big shift when the regular session resumes.
Source: Materials provided by https://articles.stockcharts.com.Note: Content may be edited for style and length.