
On the last day of the second quarter, chips looked ready to bounce back. By the end of the short trading week, that bounce had faded.
- Semiconductors dropped
- How to spot early moves
- Health‑care climbs to new highs
The chart below tells the story. Chip‑related stocks fell hard, turning the whole group red.
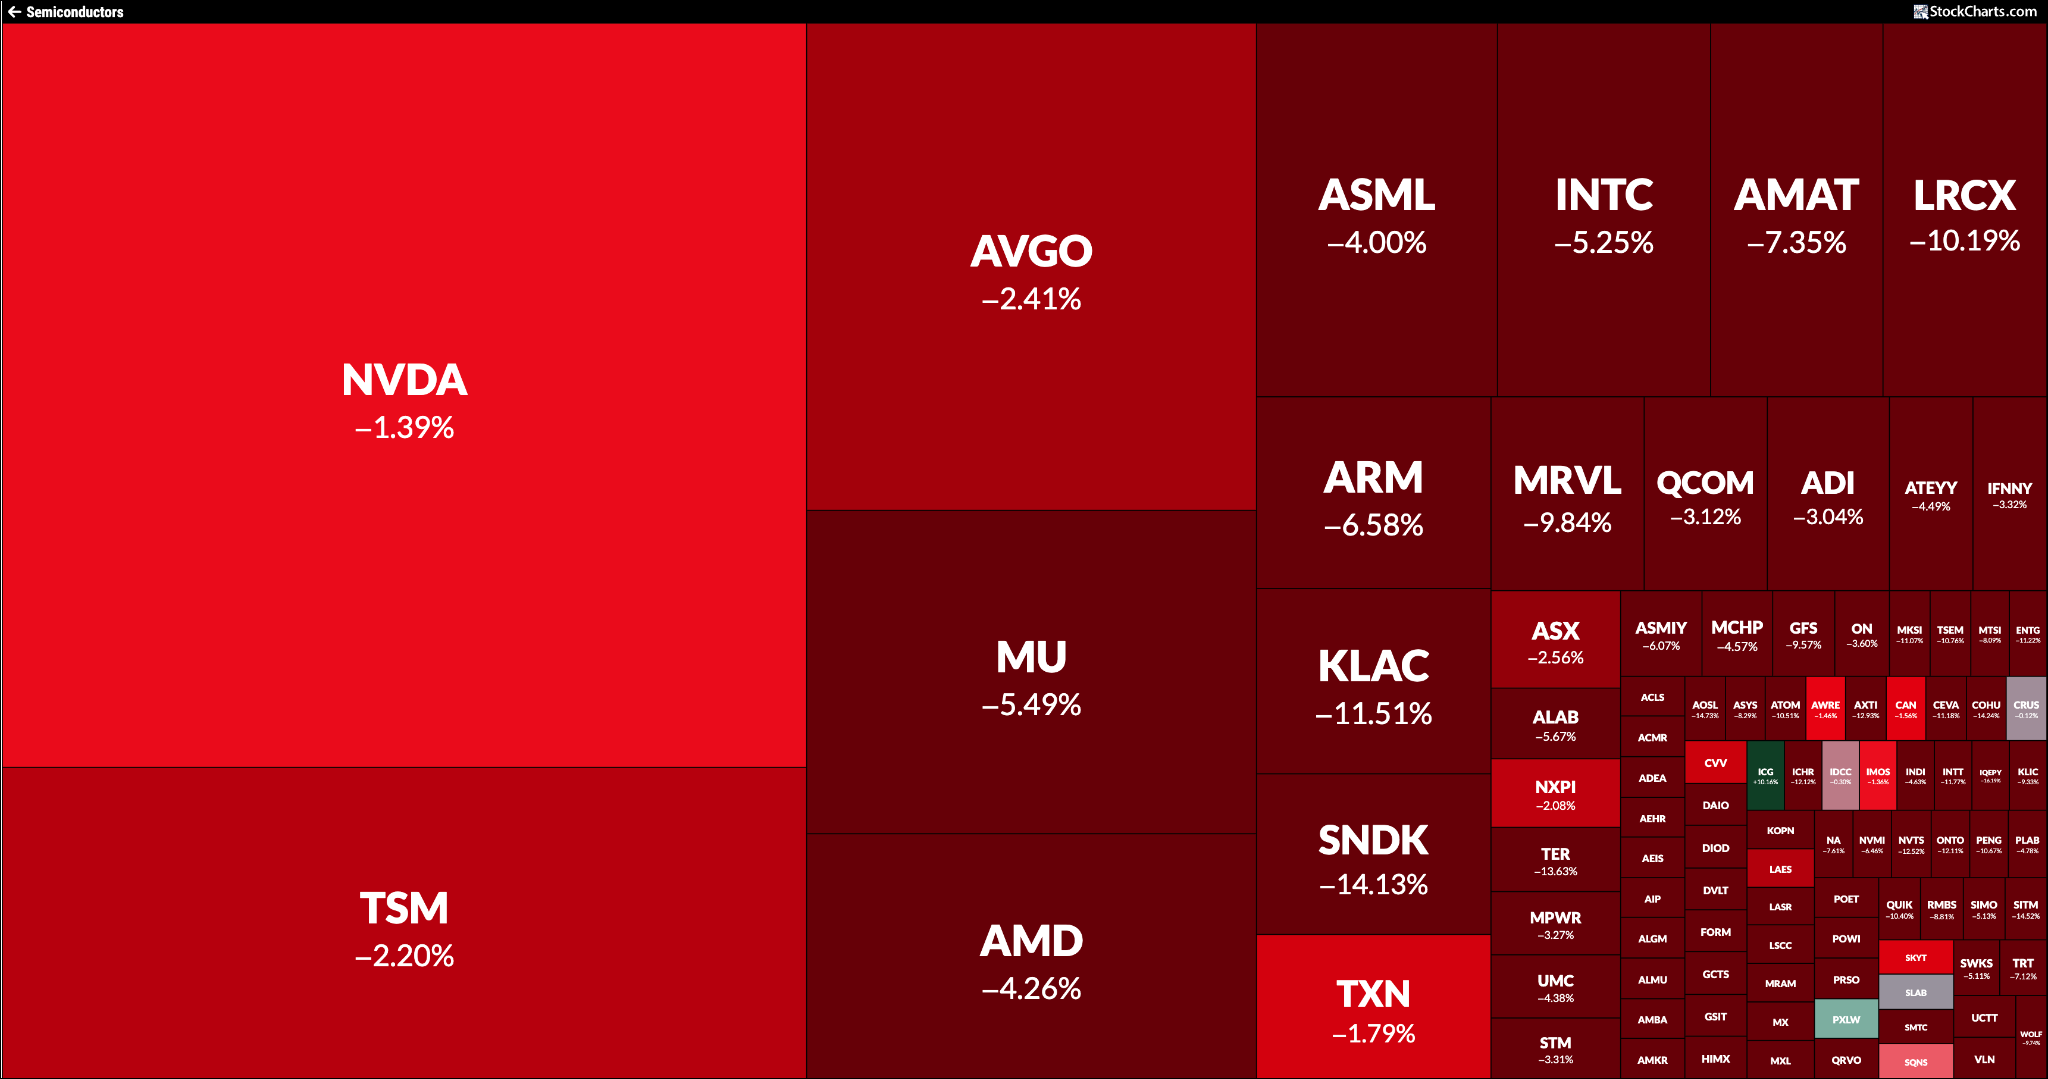
The VanEck Semiconductor ETF (SMH) slid 4.57% and dropped below its 21‑day exponential moving average, though it stayed above the 50‑day simple moving average.
What’s interesting is that the drop was not a market‑wide collapse. While tech stocks slipped, the Dow Jones Industrial Average hit a fresh record, rising 1.14%. Eight of the eleven S&P 500 sectors closed higher. Investors are simply moving money from chips to other areas.
Overall, the big indexes stay in a long‑term uptrend, market breadth is widening, and confidence remains positive.
Spotting Early Moves
After Thursday’s close, I ran a quick scan for stocks that broke above their upper Bollinger Band. The scan returned 133 symbols, with many in Financials and Health Care.
Health‑care was the day’s star sector, and its main index (XLV) closed at a record level. If that energy holds into next week, stocks like AbbVie (ABBV), Amgen (AMGN) and Gilead Sciences (GILD) could be worth watching.
Running a scan before the market opens on Monday gives you a head start. It points out where strength is building, which leaders might be changing, and which charts deserve a closer look.
You can narrow the results easily. For example, if you only want health‑care names, edit the scan criteria, pick “Health Care” from the sector list, and apply the filter. Then you can save the list or view the charts in your favorite format.
Regular scanning keeps you engaged with the market and prepares you for the trading week ahead.
Use the long weekend to explore any educational guides you have about scanning tools, and sharpen your analysis skills.
Have a safe and happy Independence Day!
Source: Materials provided by https://articles.stockcharts.com.Note: Content may be edited for style and length.