


The earnings season is already lively. Big companies like Apple, Microsoft, Meta, Amazon, Alphabet, and Tesla are reporting results just as the Federal Reserve meets in July.
Data shows that companies beating expectations are doing a little better than the S&P 500, while those missing expectations are falling sharply. This pattern holds for the two days before and after each earnings report.
Upcoming reports this week include Alphabet and Tesla on Wednesday night, IBM also on Wednesday, and Intel on Thursday. You can find the full schedule in the earnings calendar.
Low correlation across the market and wide price swings make this a good time for stock pickers. The volatility index (VIX) stays low, but the S&P 500 volatility index (VIXEQ) is higher, indicating possible future moves.
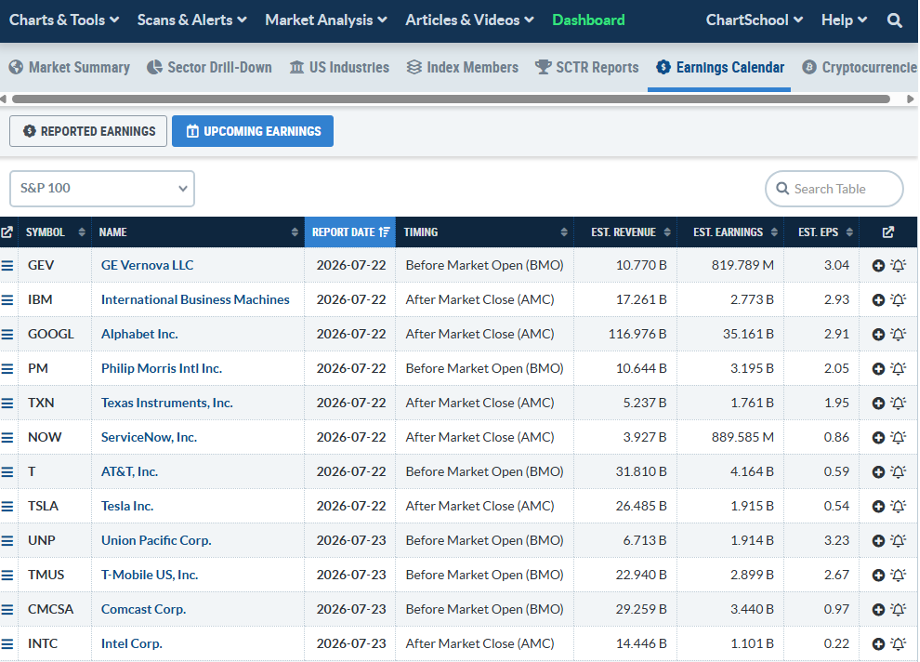
The Main Event Is Still Ahead
This week may feel tame compared with the volatility expected at the end of July. Korean chip makers SK Hynix and Samsung will report before the second‑quarter numbers from the “Mag 7” are released.
Meta and Microsoft lead on Wednesday after the market closes, followed by Apple and Amazon on Thursday. A tech conference in Santa Clara (August 4‑6) will also showcase many of the same companies.
Mega‑Caps Losing Steam
The Roundhill Big Tech ETF (MAGS) has slipped a few percent from its May peak and is still below last October’s high. It does not own this year’s top memory‑chip stocks.
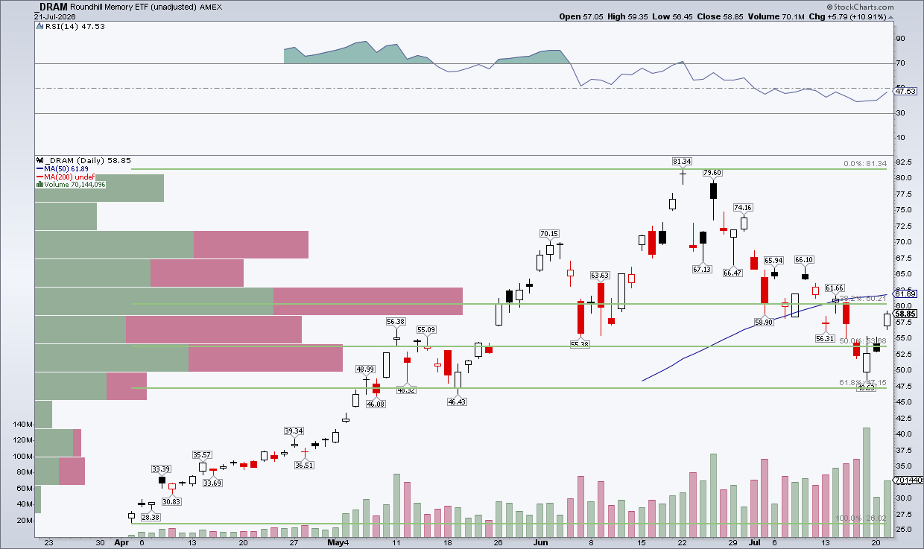
The Roundhill Memory ETF (DRAM) fell sharply from $81 to $49, then rose for three days. This shows the storage sector’s recent weakness.
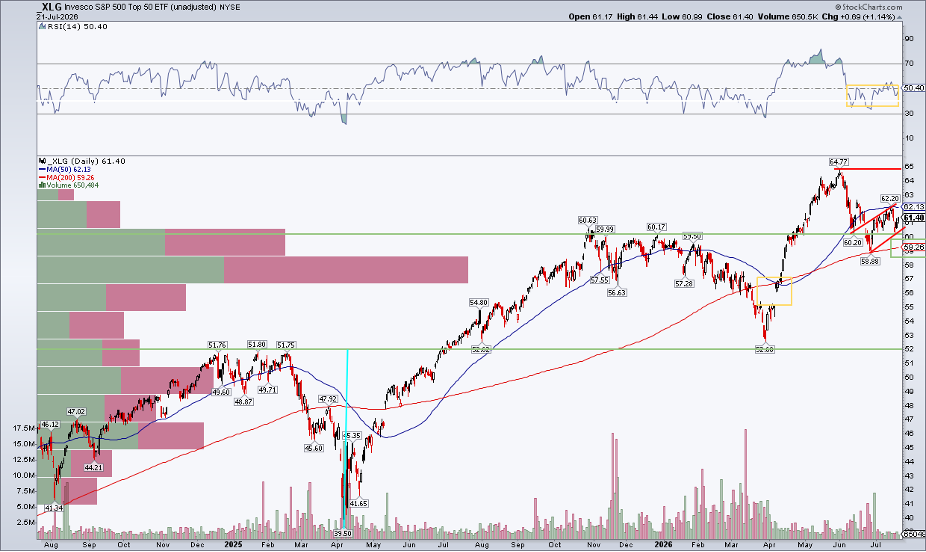
For a broader view, the Invesco S&P 500 Top 50 ETF (XLG) holds the 50 biggest U.S. stocks, including semiconductors, consumer tech, software, and AI firms. Its chart looks similar to the “glamour” stocks.
What the XLG Chart Is Telling Us
The XLG ETF is still below its June 1 high and under its 50‑day moving average. It did find buyers near the 200‑day line earlier this year.
The RSI momentum indicator sits between 35 and 55, a neutral range. A rise above the 50‑day average and an RSI near 70 would signal stronger upward momentum.
Is a Bear Flag Forming?
A price gap near $55 still exists. If a typical mid‑term election‑year correction occurs, the gap could close.
July’s calm may be a false sense of security. If the price breaks lower, $55 becomes a target, with strong support around $52.
A measured‑move target of $64 was set after a breakout in June, based on past price swings.
Seasonality Isn’t Helping
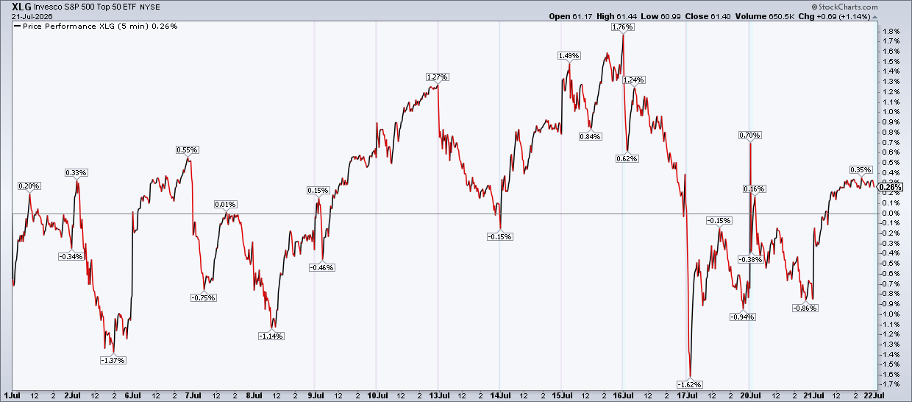
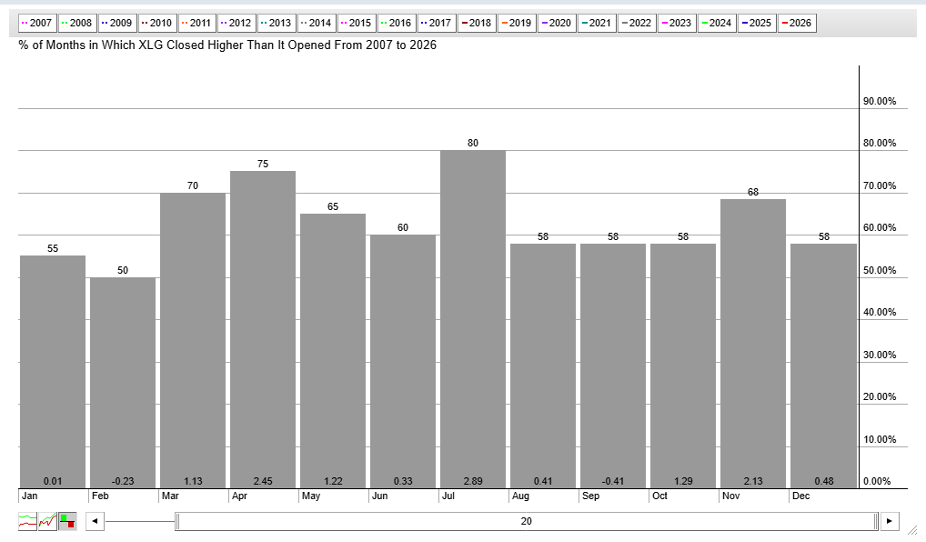
Historically, July is a strong month for the S&P 500’s top 50 stocks, averaging a 2.9% gain since 2007. This year, XLG has been flat, missing its usual July lift.
If mega‑cap earnings this week disappoint, the ETF could face a tough run into the typically bearish late‑summer period.
Bottom Line
U.S. mega‑caps are having a slow summer. Apple is still strong, but it looks more defensive now. Nvidia, Alphabet, and Amazon have all pulled back from recent highs.
The next few days will test the market: big earnings reports, the Fed meeting, and the build‑up to the election season.
Disclaimer: This content is for educational purposes only and does not constitute financial advice.
Source: Materials provided by https://articles.stockcharts.com.Note: Content may be edited for style and length.