


In mid‑July 2026 the market is shifting away from tech leaders. Semiconductor stocks are losing steam and falling below important moving averages. At the same time, banks and other financial companies are gaining strength.
Higher interest rates are helping value‑focused financial firms beat the broader market. Below we look at three major banks, their recent price patterns, and the levels traders should watch.
Morgan Stanley (MS)
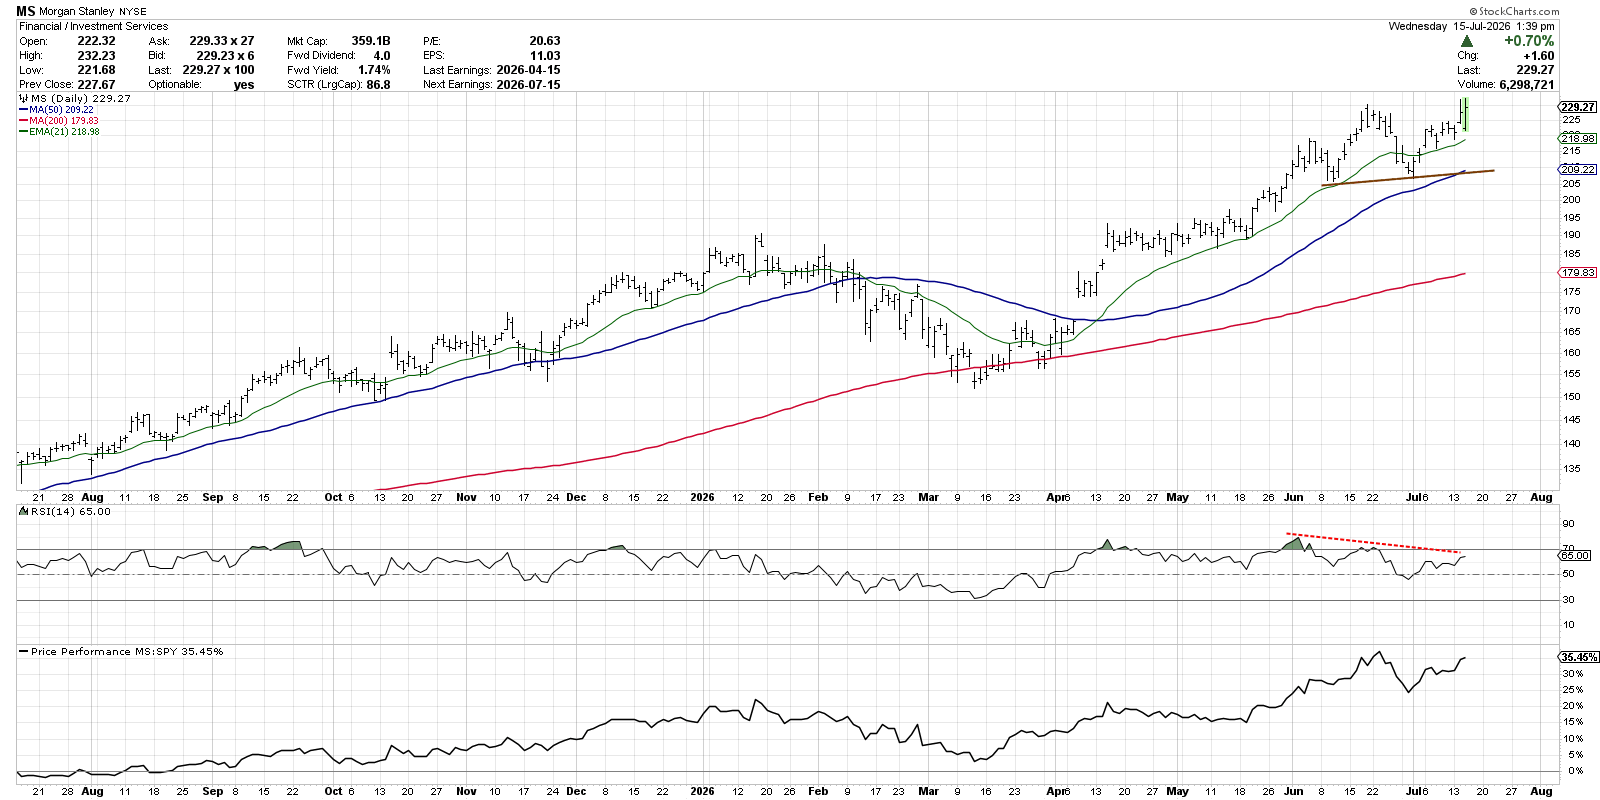
Morgan Stanley has been climbing higher for the past three months. The price makes higher highs and higher lows, which is a classic up‑trend sign.
During an up‑trend, the most important clue is the low points. As long as each new low stays above the previous one, buyers are still in control.
Right now the stock sits comfortably above its 50‑day moving average, which itself is rising. The line that connects recent lows in June and July also slopes upward. If those support points hold, the up‑trend looks solid.
Bank of America (BAC)
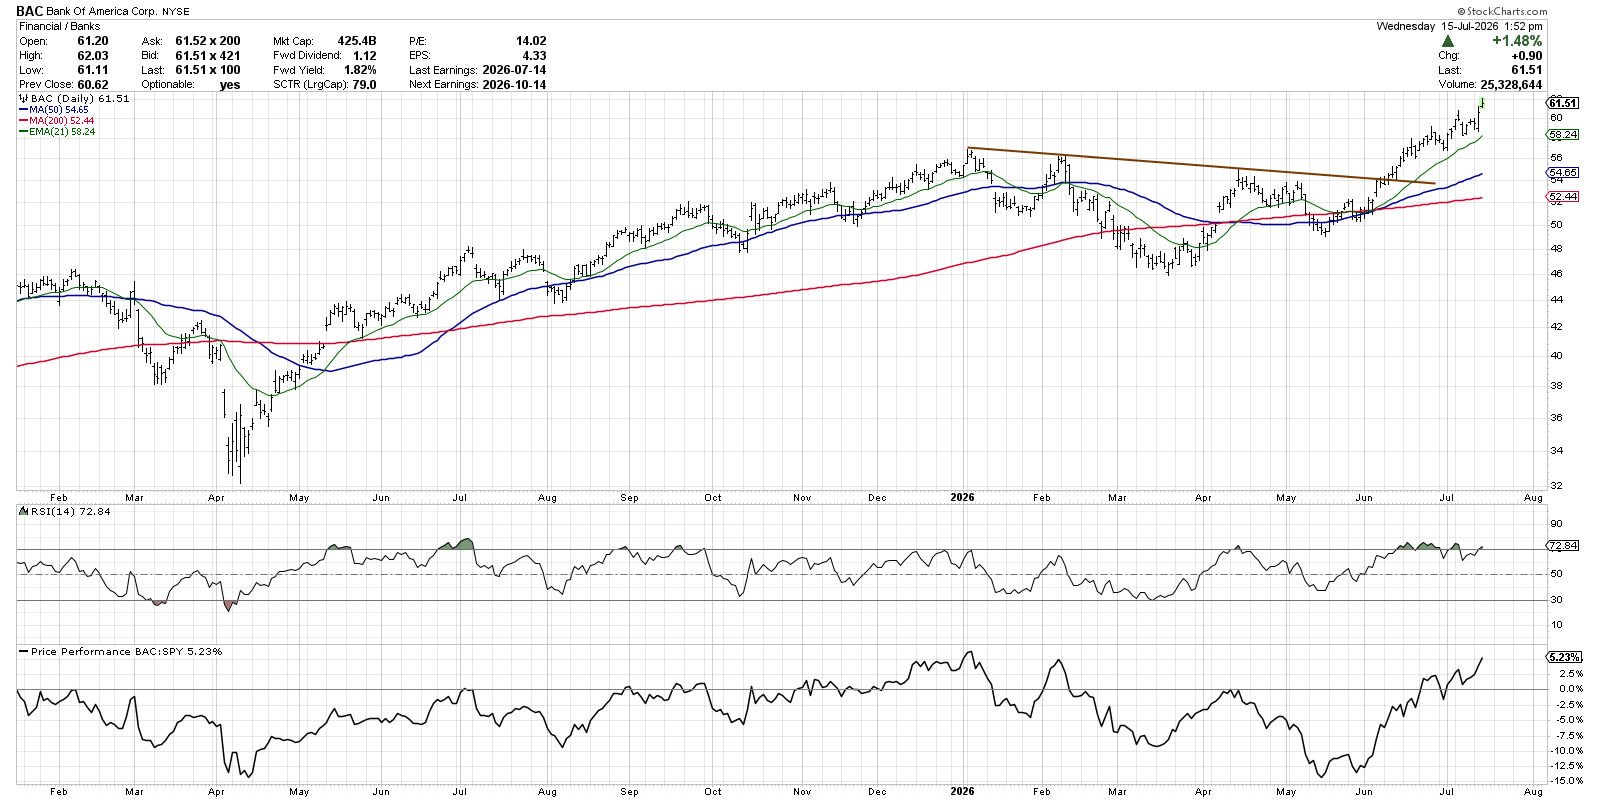
Bank of America faced a tougher road after the March lows. A drop in April and May pushed the price below its 200‑day moving average.
In late May the stock formed an inverted head‑and‑shoulders shape, a pattern that can signal a new rise after a downtrend. When the price broke above the pattern’s neckline in early June, the RSI moved above 60, showing growing buying interest.
Since then the chart shows higher highs and higher lows, staying above rising moving averages. As long as the pattern holds, the stock appears ready to keep moving up.
Wells Fargo (WFC)
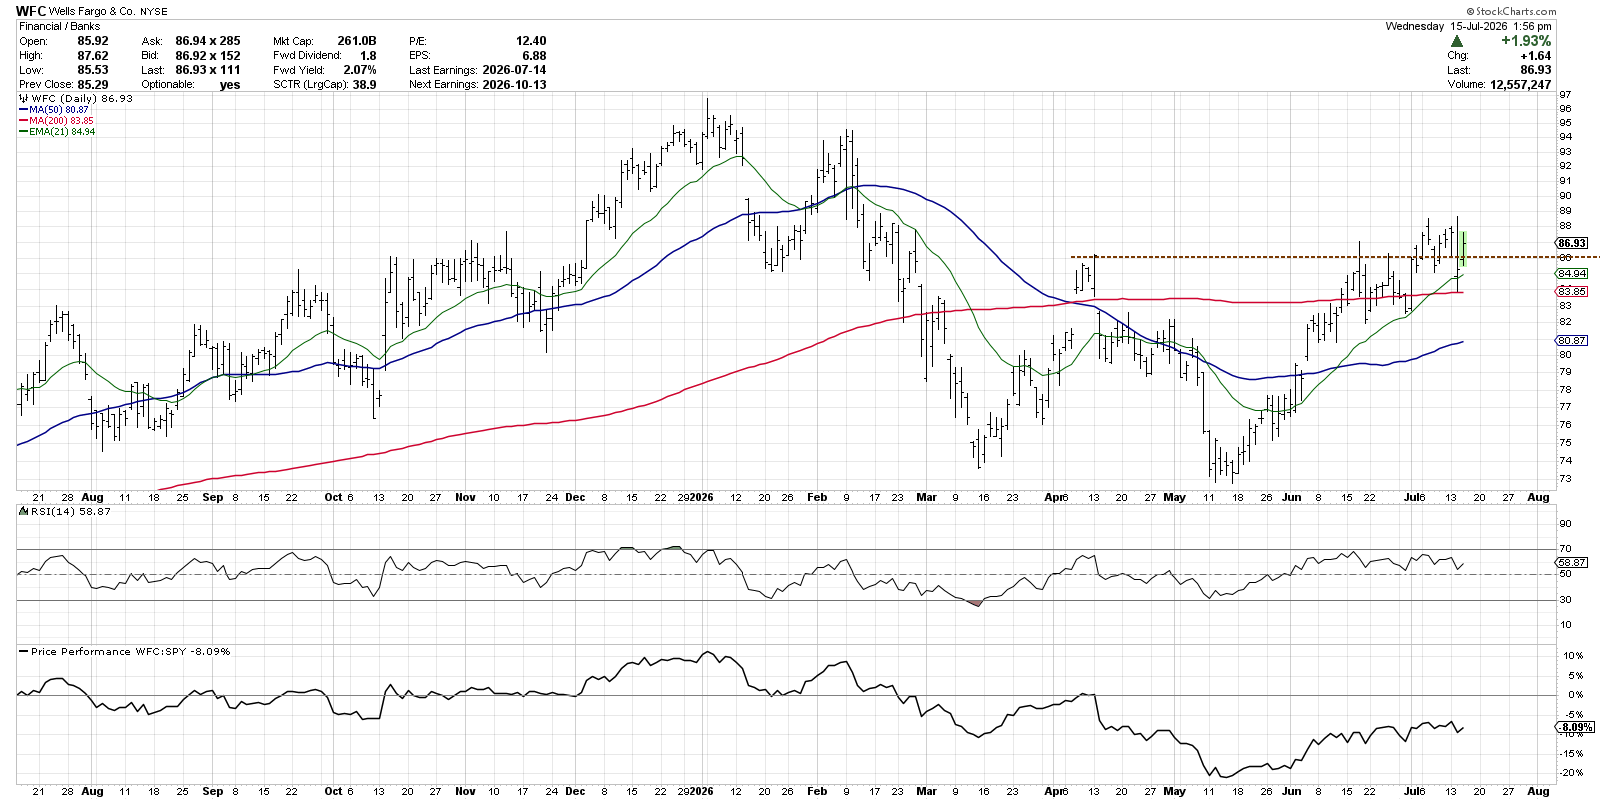
Wells Fargo also struggled after the March low, falling back to that level in May. The price found steady support near $73 and later tested the June high.
After a period of sideways movement, the stock finally broke above the $86 resistance line and made a new swing high in early July.
Although the breakout is promising, there have been few strong follow‑through days, meaning additional buying pressure is not yet clear. Traders should watch the 200‑day moving average for support, as a break below that level can be a warning sign.
These three banks illustrate how the financial sector is taking the lead in the current market rotation. Their charts show clear up‑trend structures, supportive moving averages, and key price levels to monitor.
Source: Materials provided by https://articles.stockcharts.com.Note: Content may be edited for style and length.