

Wall Street is watching the jobs numbers for April and May. The data could be a turning point for the Industrials sector, which has fallen behind the broader market this year.
AI Has Been the Main Story
All the talk about artificial intelligence (AI) has helped tech stocks soar. Funds like XLK (technology) are up more than 50% from their March lows. Even software‑focused funds such as IGV have turned positive for 2026.
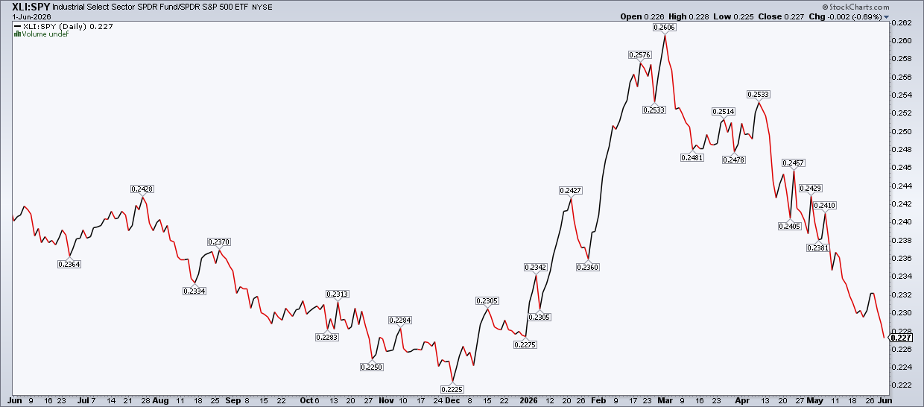
Meanwhile, industrial stocks have not risen as fast. The XLI fund, which tracks Industrials, hit a year‑to‑date low just before the latest jobs reports were released.
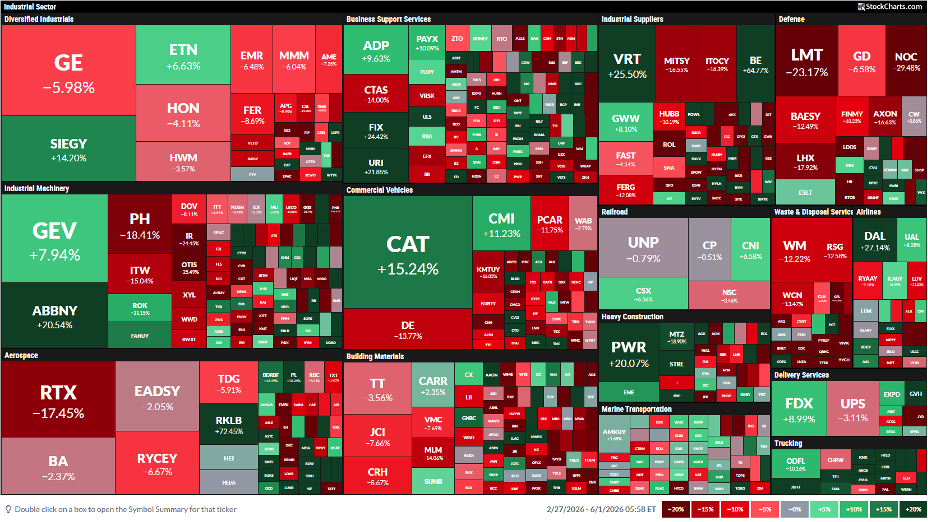
Companies like Caterpillar have gained more than 15% over the past three months, but many industrial names are still down. GE Aerospace, once thought to benefit from AI, is down 6% since March. Defense giants such as RTX, Lockheed Martin, and Northrop Grumman have also slipped.
What Could Spark a Turnaround?
Strong employment numbers could be the boost industrials need. In a market dominated by AI and tech hardware, fresh job data may shift money toward cyclical sectors.
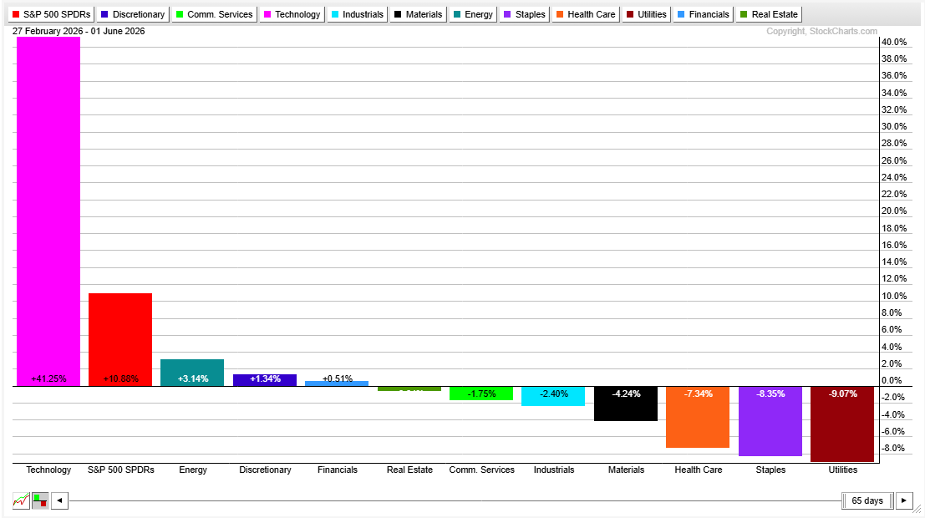
Since the war began, technology has outperformed every other sector, delivering a 41% return. Energy is the next best performer with a modest 3% gain. Seven of the eleven S&P 500 sector ETFs are still in the red since March.
Industrial Charts Look Better Than Headlines Suggest
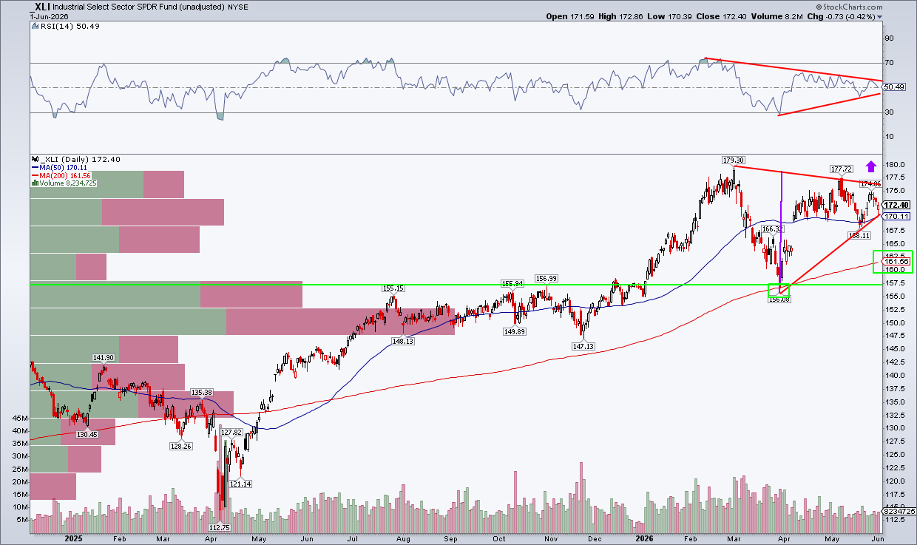
Looking at XLI alone, the price chart is not ugly. The fund is trading below its March high of $179, but the recent low around $156 seems firm. The 200‑day moving average is rising, which means the long‑term trend is still upward.
With many economic releases coming and interest rates holding steady for now, the price pattern forms a symmetrical triangle—a sign that the current trend could continue.
Potential Breakout Target
If XLI breaks above $178, the pattern suggests a move toward $200. Triangles are continuation patterns, so the larger uptrend would likely keep going.
The RSI momentum indicator is also flattening. Since momentum often moves before price, traders should watch the RSI for early clues.
Even if the market sells off in the summer, there is strong buying volume around the mid‑$100s, which could cushion any drop. A gap at $164, if filled, might push the price back toward the 200‑day average.
Can AI Help Industrials?
AI could eventually lift industrial stocks, especially if interest rates ease and inflation cools. The impact of AI often spreads from tech to other sectors over time.
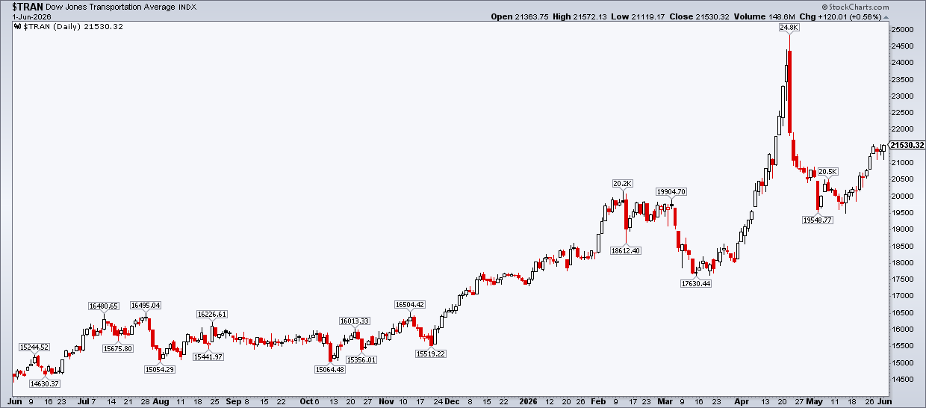
Under the industrial umbrella, the Dow Jones Transportation Average has reached record highs, except for a short meme‑stock surge in April. The Dow Jones Industrial Average continues to set new peaks, showing that blue‑chip stocks are still in favor.
Sector Rotation and Seasonality
In a healthy bull market, money moves from one leading sector to another. This rotation lets investors spread risk and capture new opportunities.
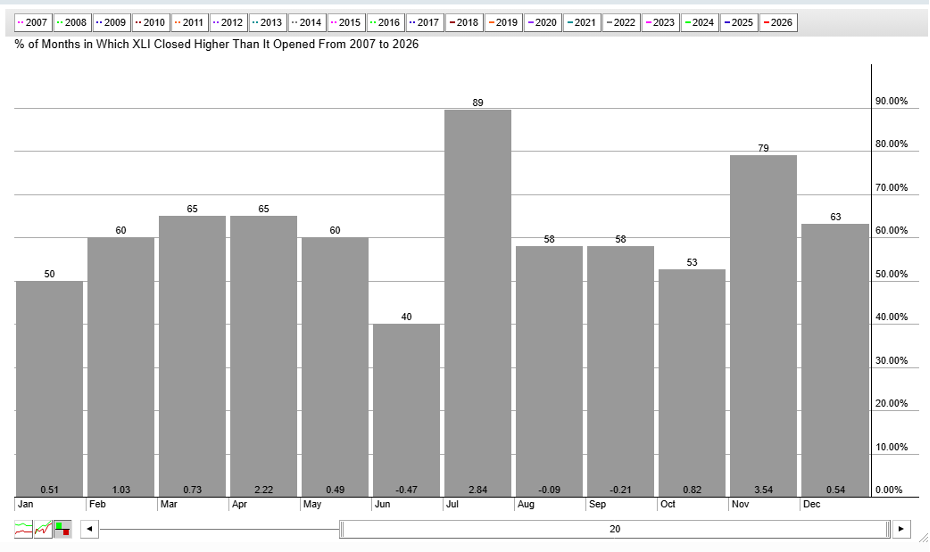
Historically, June has been a weak month for Industrials, averaging a 0.47% decline since 2007. July, on the other hand, has been positive about 89% of the time, with an average gain of 2.84%.
Bottom Line
The recent conflict in Iran hurt aerospace and defense makers in the Industrials sector. XLI slipped to a fresh year‑to‑date low versus the S&P 500 at the start of June. Upcoming macro data could act as a catalyst.
The chart shows a constructive pattern after months of consolidation. For risk‑aware traders, moving some profits from hot AI names into Industrials could be a smart move.
Disclaimer: This article is for educational purposes only and does not constitute financial advice. Always consider your personal situation and consult a professional before making investment decisions.
Source: Materials provided by https://articles.stockcharts.com.Note: Content may be edited for style and length.