

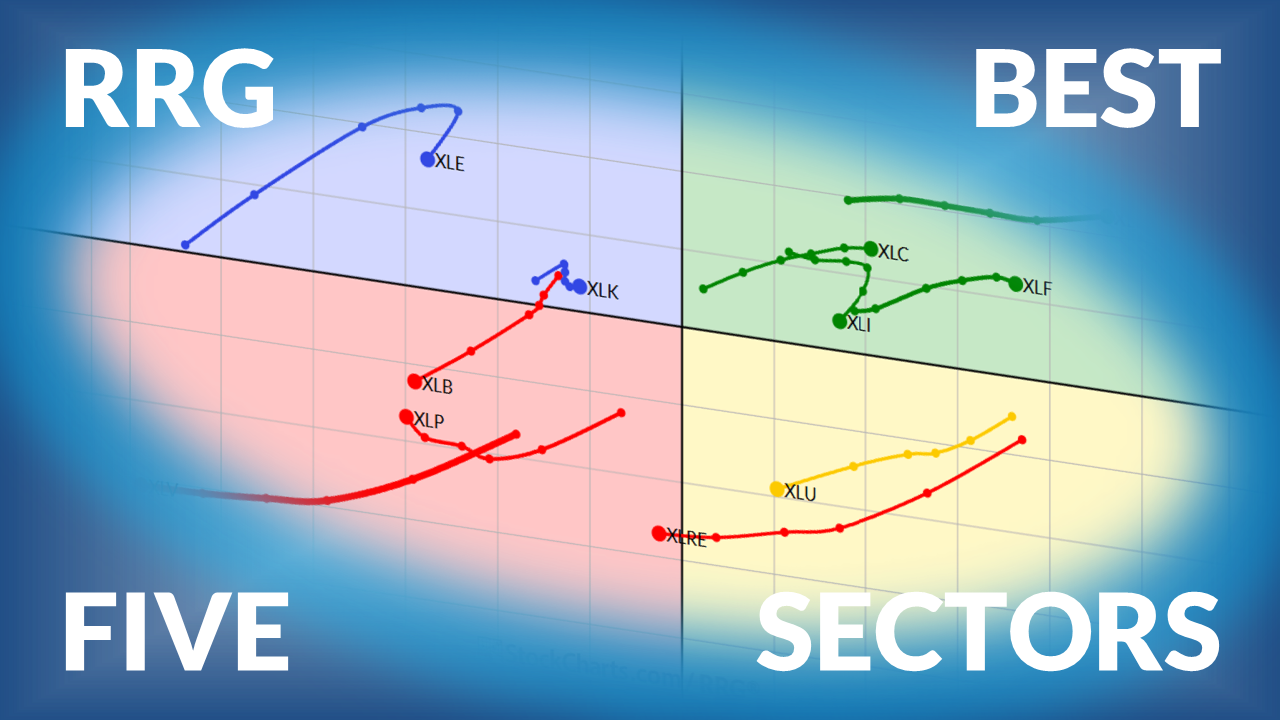
Technology Takes the Lead
During the week that ended on May 29, the S&P 500 rose about 1.5%. The move changed the order of the top sectors.
- Technology moved up to the #1 spot.
- Energy fell to #2.
- Materials stayed at #3.
- Real estate climbed to #4.
- Industrials held steady at #5.
Consumer staples slipped out of the top five and now sits at #6. The rest of the sectors keep the same order: utilities #7, communication services #8, consumer discretionary #9, health care #10, and financials #11.
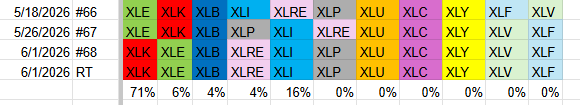
- Technology (XLK) – 71% weight
- Energy (XLE) – 6% weight
- Materials (XLB) – 4% weight
- Real Estate (XLRE) – 4% weight
- Industrials (XLI) – 16% weight
- Consumer Staples (XLP)
- Utilities (XLU)
- Communication Services (XLC)
- Consumer Discretionary (XLY)
- Health Care (XLV)
- Financials (XLF)
Weekly RRG Overview
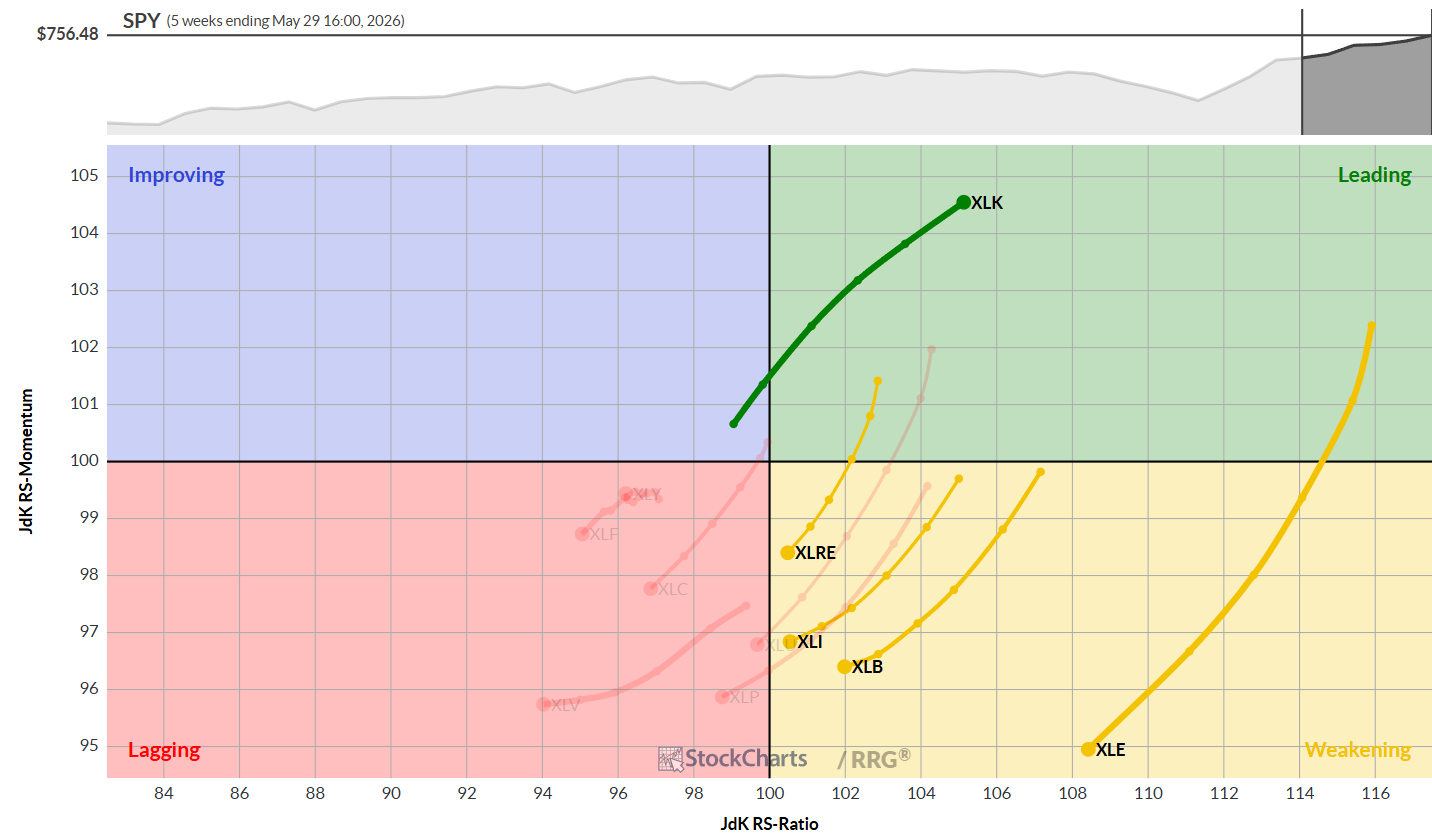
The weekly Relative Rotation Graph shows technology as the only sector in the leading quadrant. Energy, materials, industrials and real estate are all moving toward the weakening quadrant.
Daily RRG Overview
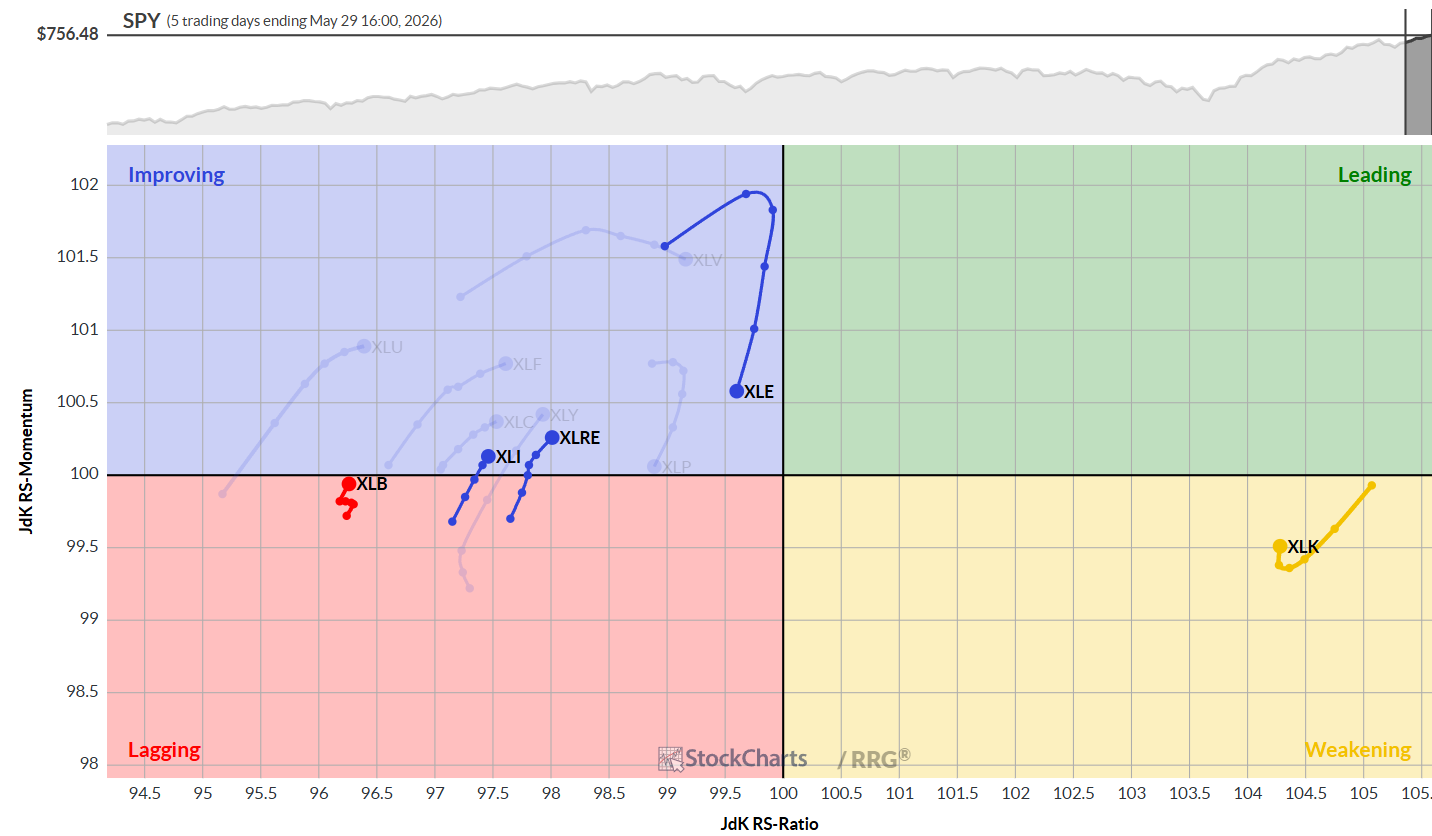
On the daily chart, technology has slipped into the weakening quadrant but shows a small upward hook, hinting it might return to leadership. Energy, real estate and industrials are in the improving quadrant, while materials is at the bottom but starting to rise.
Sector Performance Highlights
Technology
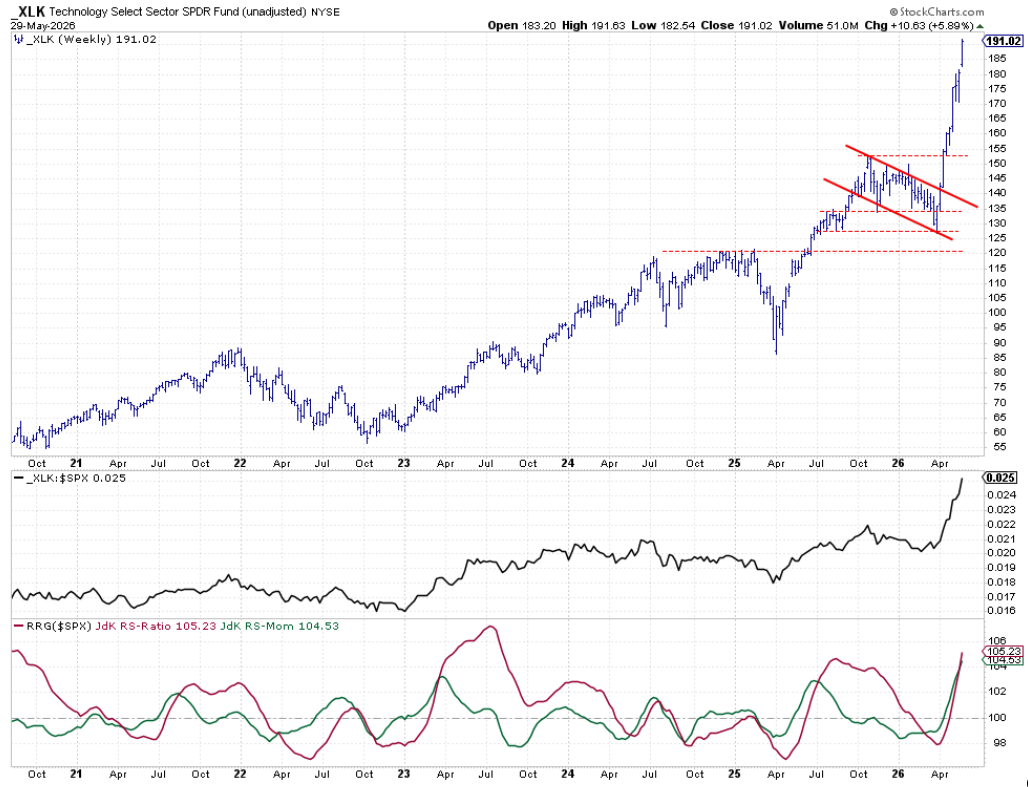
Tech prices kept climbing and closed near the top of the weekly bar. Both the raw relative‑strength line and the RRG lines stay strongly positive.
Energy
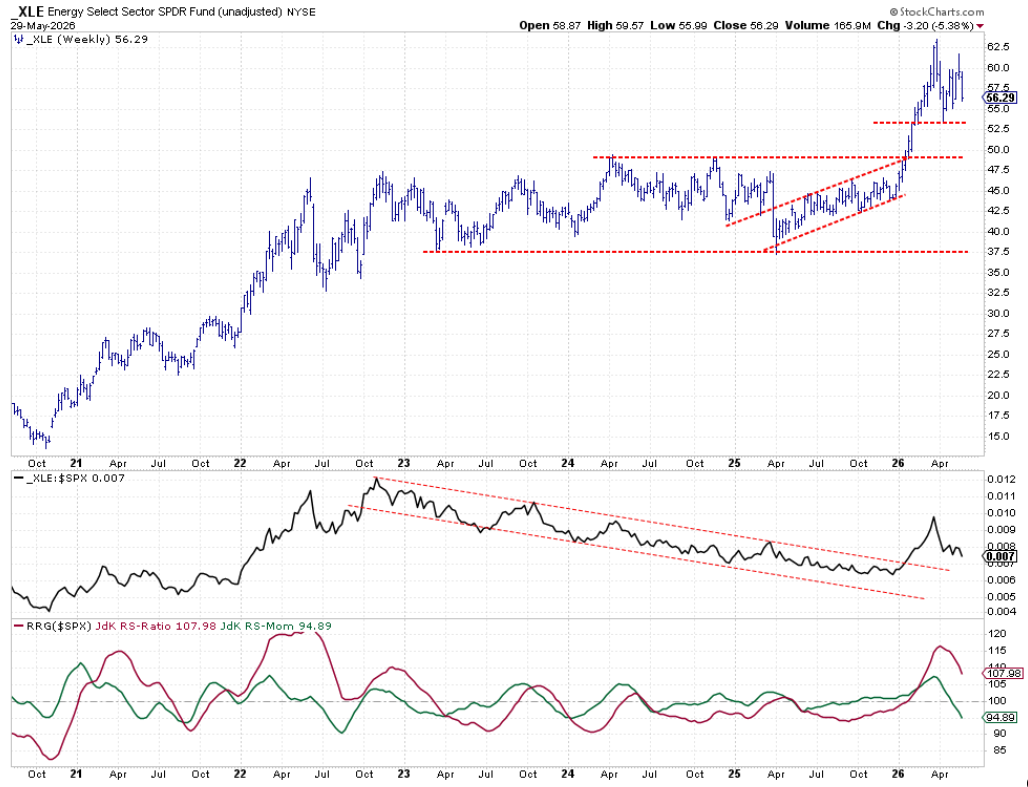
Energy fell to the second spot as its price steadied and slipped a little. The raw RS line is flattening and still has room to fall before turning negative.
Materials
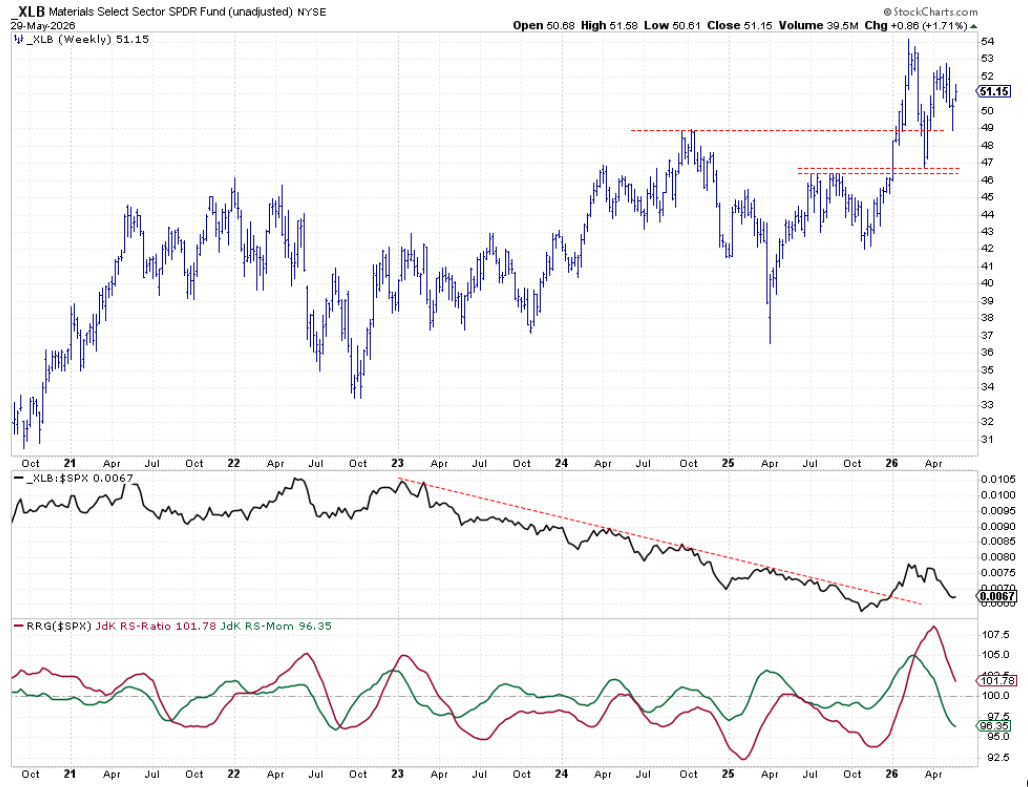
Materials had a solid week, but the overall trend is flat. If the sector can set a higher low, it may start an uptrend again.
Real Estate
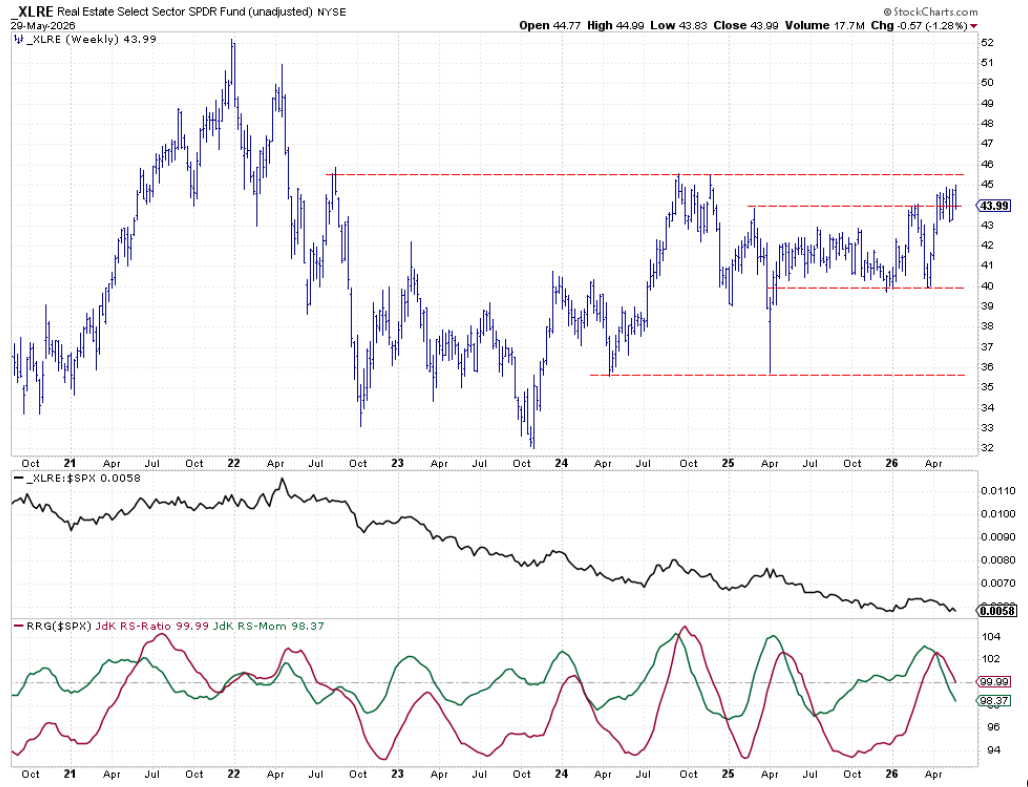
Real estate entered the top five and is holding above its recent resistance near 44. The raw RS line stays above last year’s low, even though the RRG lines are slipping.
Industrials
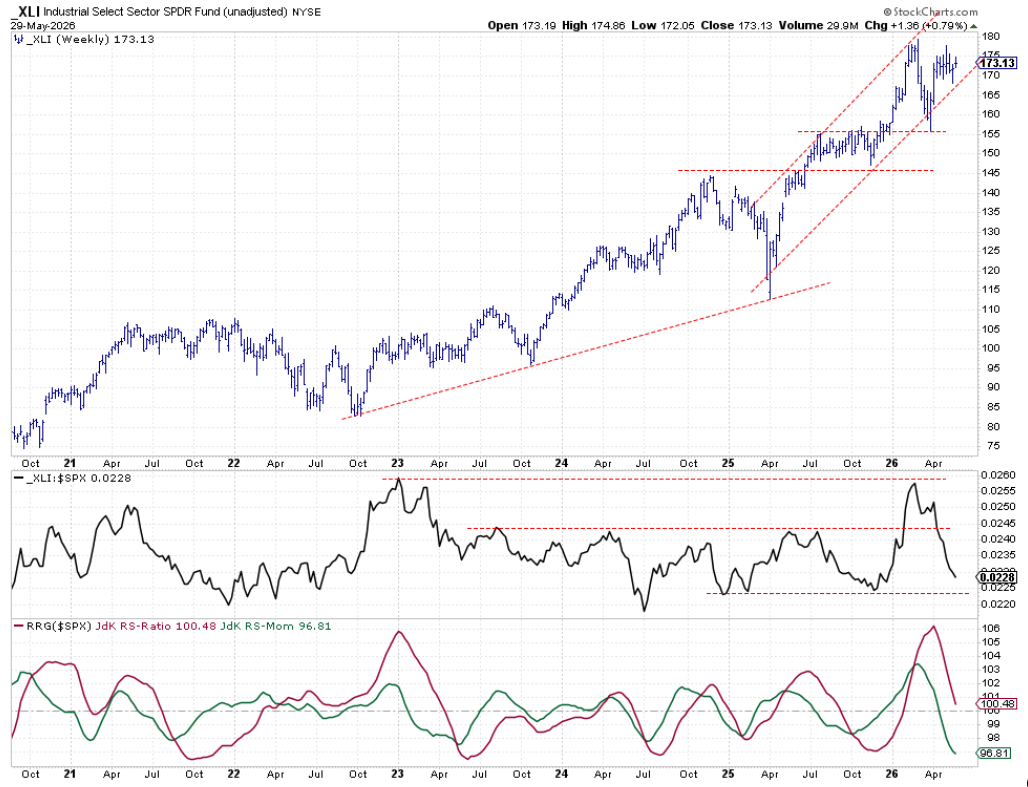
Industrials are moving sideways inside a rising channel. The raw RS line is sliding toward older support levels, and the RS ratio is close to dropping below 100, which would push the sector into the lagging quadrant.
Portfolio Composition and Performance
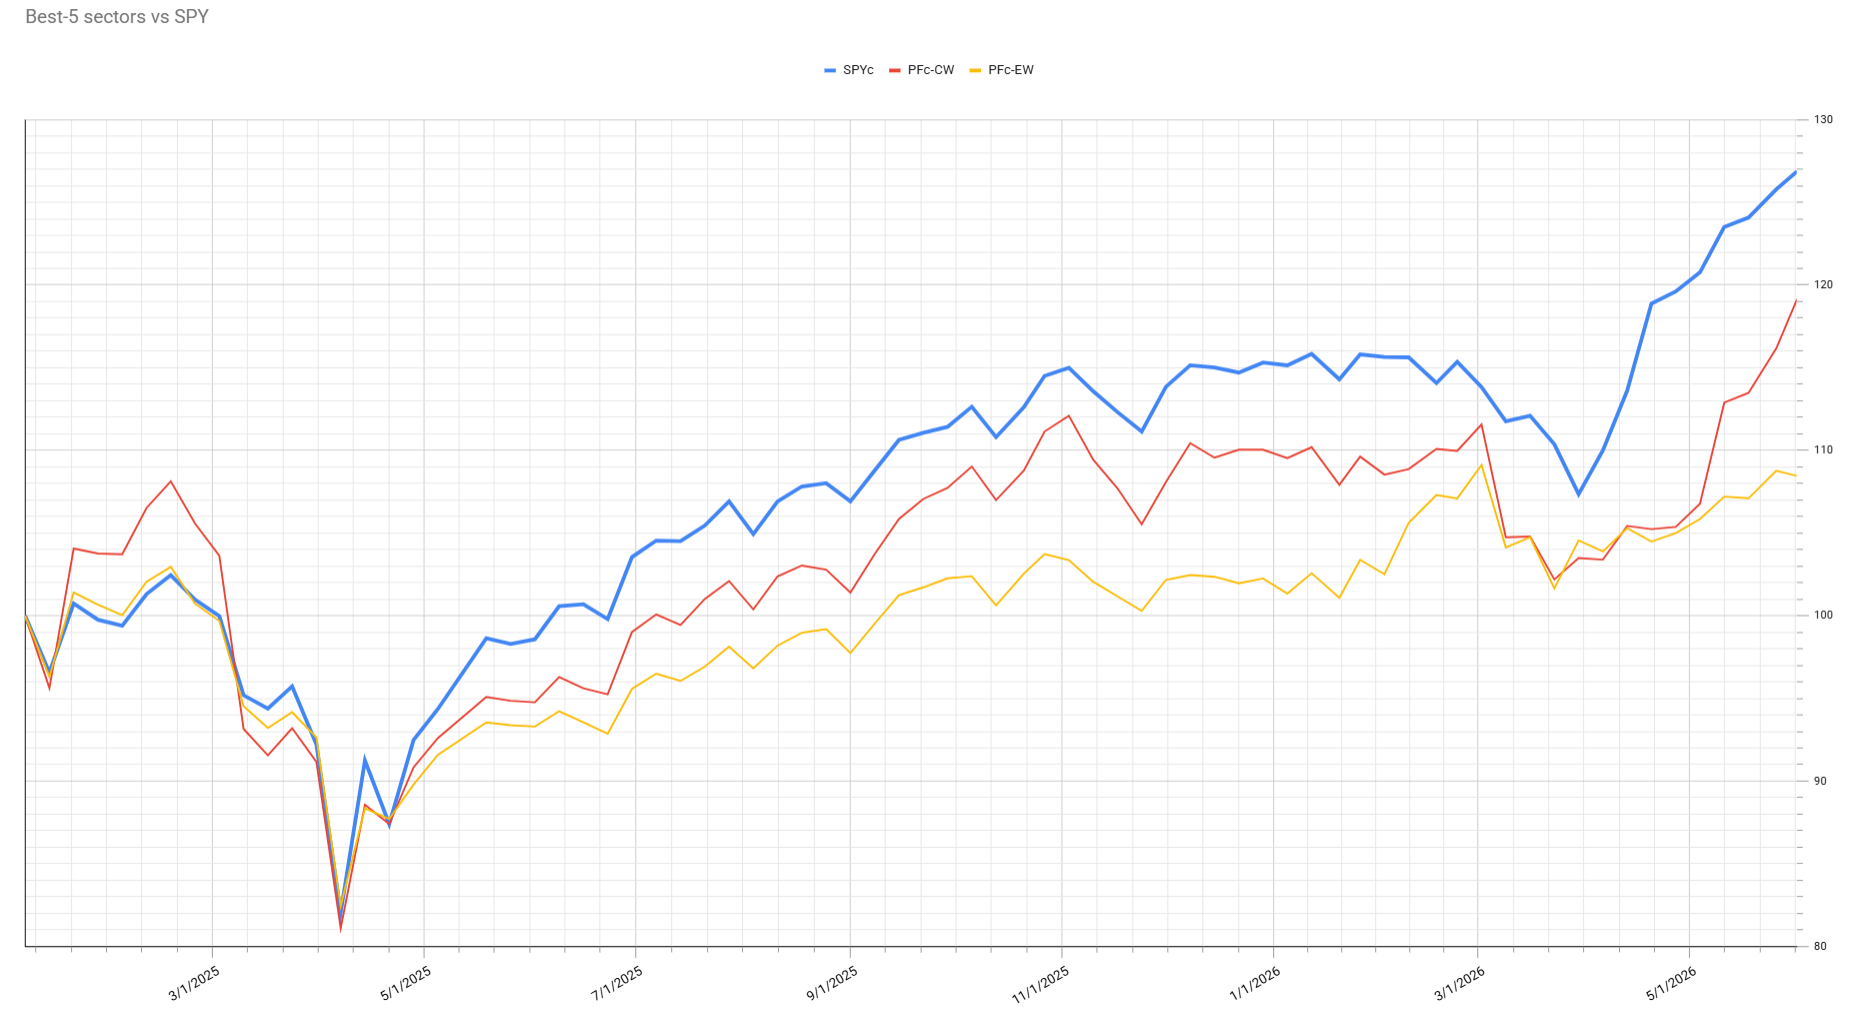
Technology now makes up 71% of the cap‑weighted model. The portfolio is catching up to the S&P 500 fast, closing the gap to 7% after being over 14% five weeks ago. Ongoing strength from tech is key to future gains.
Conclusion
Tech’s climb to the top is driving the portfolio and reshaping the market picture. While other sectors show small improvements, the next moves will depend on whether technology can stay strong.
Source: Materials provided by https://articles.stockcharts.com.Note: Content may be edited for style and length.