

The Relative Strength Index, or RSI, is a popular tool that measures how fast prices move up or down. Many traders only look at the numbers 70 and 30, calling them "overbought" or "oversold". While that can help, the real power of RSI is in its overall range.
Looking Beyond Simple Signals
RSI was created by J. Welles Wilder. It compares recent gains to recent losses, usually over 14 periods. Short‑term traders may use a smaller setting, like five periods, to catch quick moves.
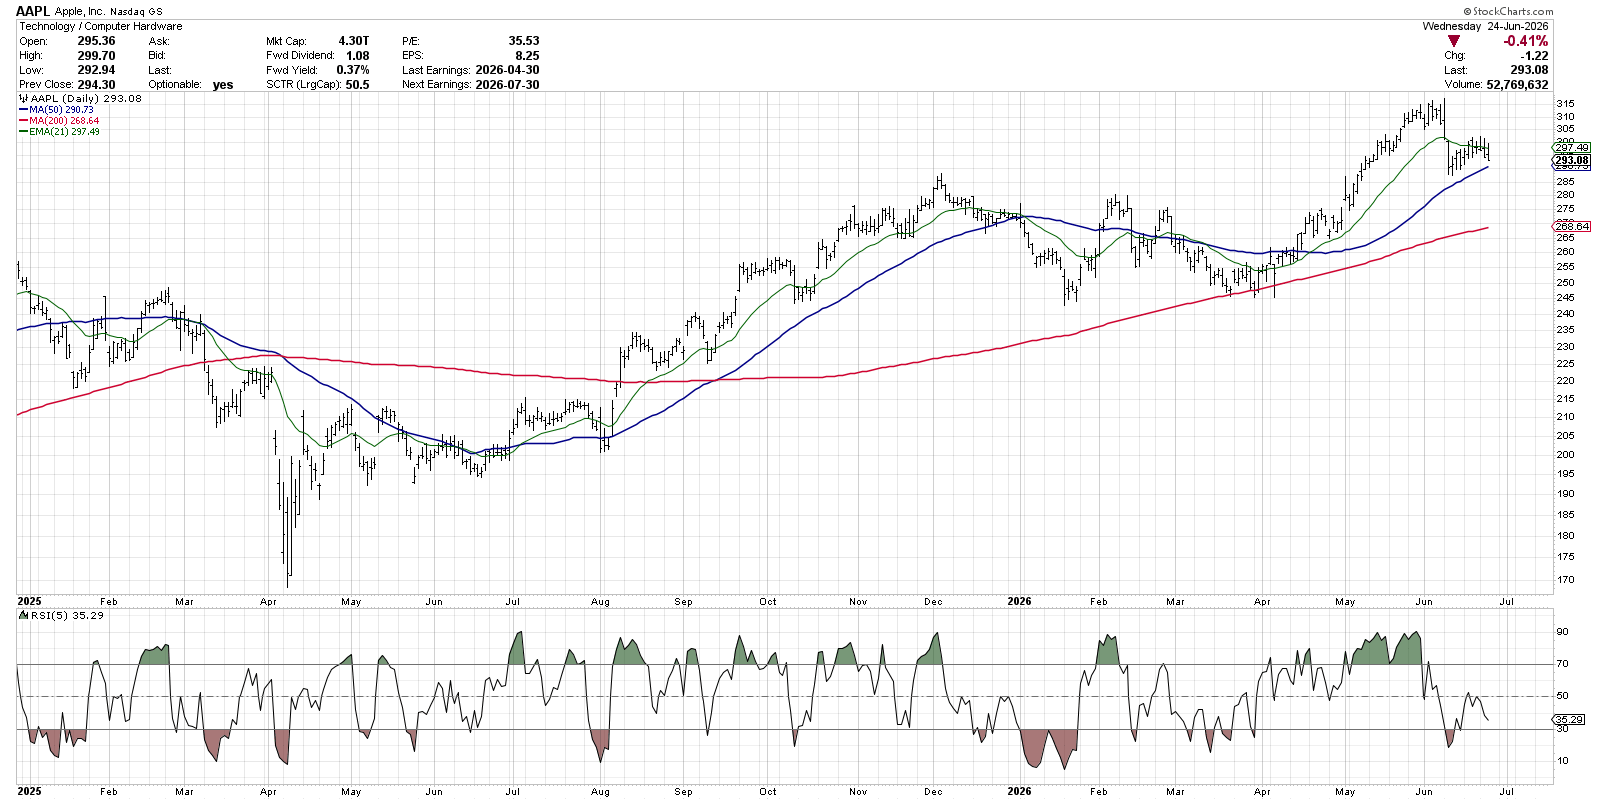
On a fast‑moving stock like Apple (AAPL), a five‑period RSI often hits the extreme zones. Those spikes can help a swing trader time entries and exits. But they don’t tell the whole story about the market’s direction.
How the RSI Range Shows the Trend
Instead of watching a single high or low, look at where the RSI spends most of its time. In a strong uptrend, the line usually climbs above 70 during rallies but stays above 40 during pull‑backs. In a downtrend, it rarely goes above 60 and often drops below 30.
When the market is flat, the RSI bounces between roughly 40 and 60. That tells you buyers and sellers are balanced.
Apple Example
The chart below shows Apple’s 14‑period RSI during three different phases.
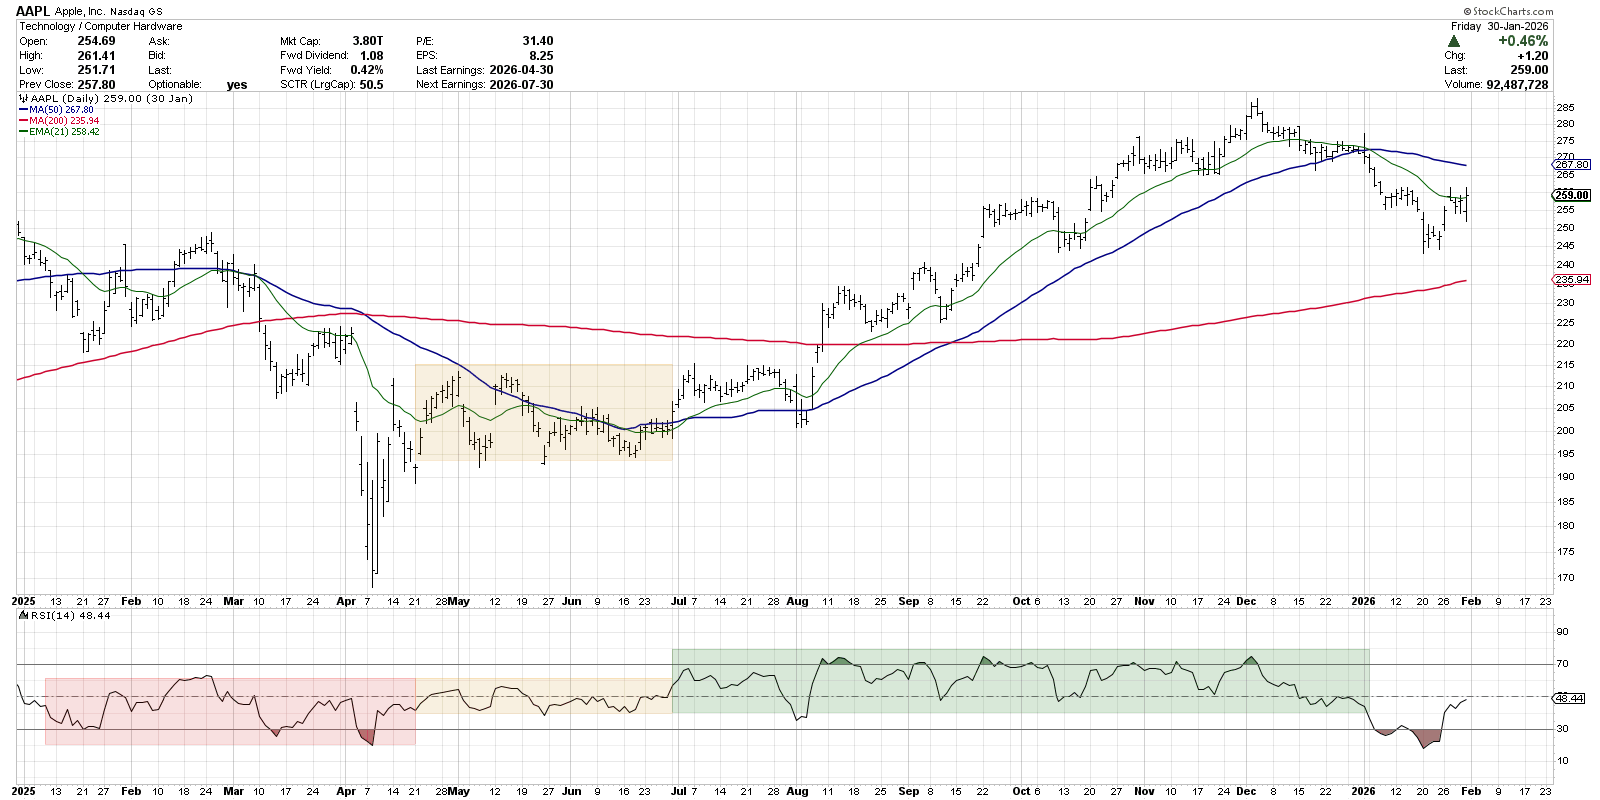
In early 2025 the stock fell, and the RSI stayed low, confirming that sellers were in charge. After a deep low in April, Apple moved sideways. The RSI hovered between 40 and 60, showing a neutral market.
When the price began to rise in July, the RSI moved higher. Pull‑backs stayed above 40 and rallies often hit the overbought area. This shift signaled a new uptrend.
If you already own the stock, watch the RSI. As long as it stays above 40, short dips are likely just normal corrections. A sustained drop below 40 may warn that the uptrend is weakening.
Applying the Idea to the S&P 500
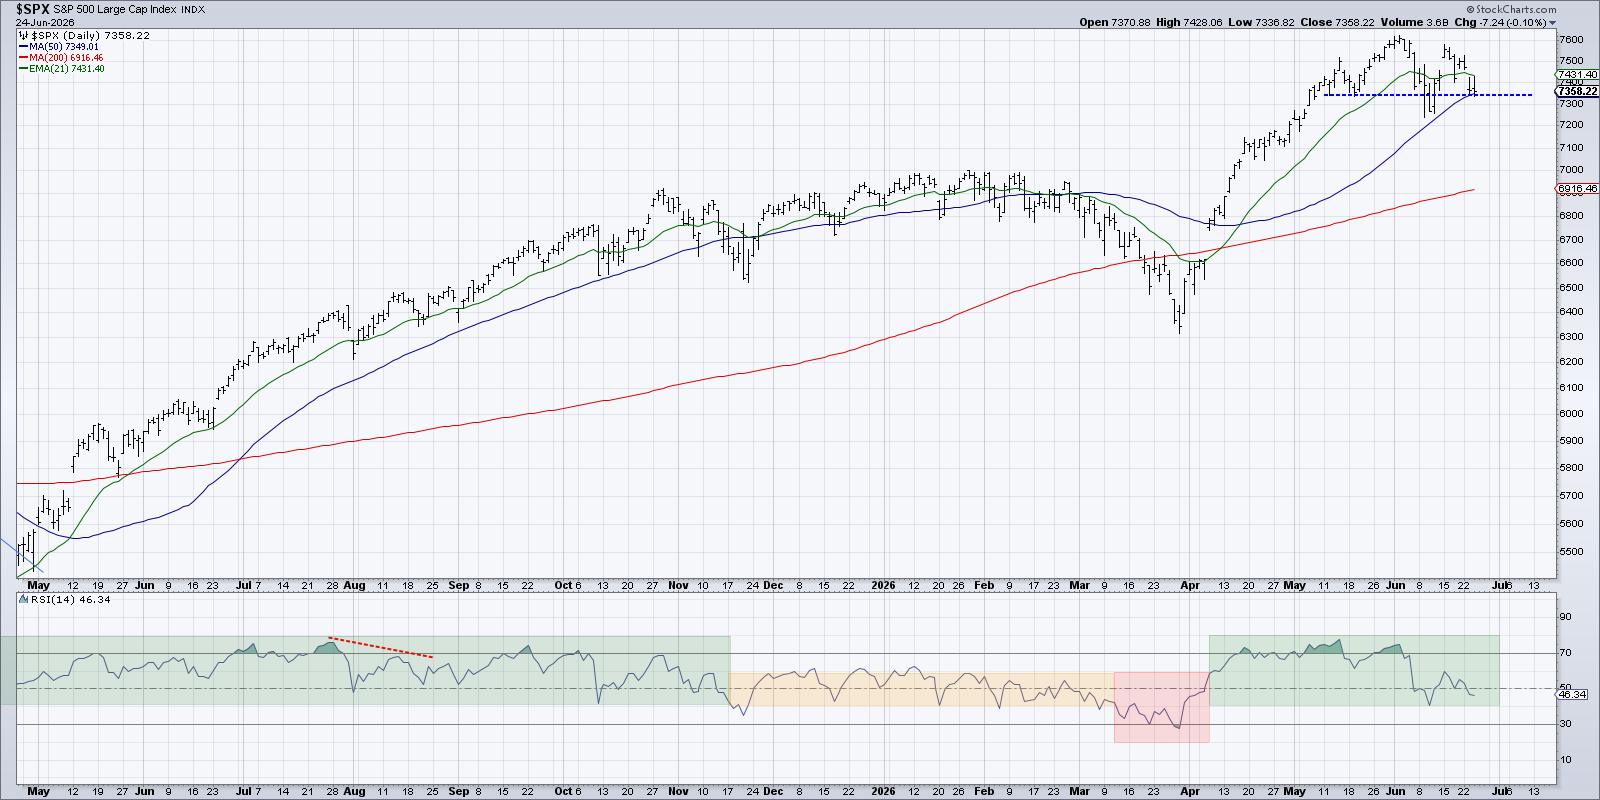
In the second half of 2025 the S&P 500 stayed in a strong uptrend. The RSI was mostly in the bullish range. At the end of the year the index moved sideways and the RSI fell between 40 and 60, indicating a pause.
When the price broke below support and the RSI slipped under 40, a bearish phase began. Later, as the RSI climbed back above 60, a new uptrend started.
Right now the index is above key support, but the RSI is drifting toward 40. If it settles in a neutral band, the market may stay flat. If it falls lower, a new downtrend could be forming.
Key Takeaway
Most people only watch the 70/30 levels on the RSI. Those points can help, but the true insight comes from looking at the whole range. The range tells you whether the market is gathering strength, staying flat, or losing momentum.
Combine the RSI range with price patterns and moving averages. This simple method gives a clearer picture of what the market is doing.
Next time you open a chart, ask yourself: "Where does the RSI spend most of its time?" The answer often reveals the real trend.
Disclaimer: This material is for educational purposes only. It does not constitute financial advice. Always consider your own situation and consult a professional before making investment decisions.
Source: Materials provided by https://articles.stockcharts.com.Note: Content may be edited for style and length.