


News headlines are shaking the market. Last Friday the price action looked like a correction might be forming. Will the weakness spread into this week? Let’s look at the charts.
A Walk Through the Charts
On Friday the S&P 500 fell below its 21‑day exponential moving average (EMA). Since then the index has not closed above that line, and the EMA is now turning lower. The index is now moving toward its 50‑day simple moving average (SMA), which could act as the next support level.
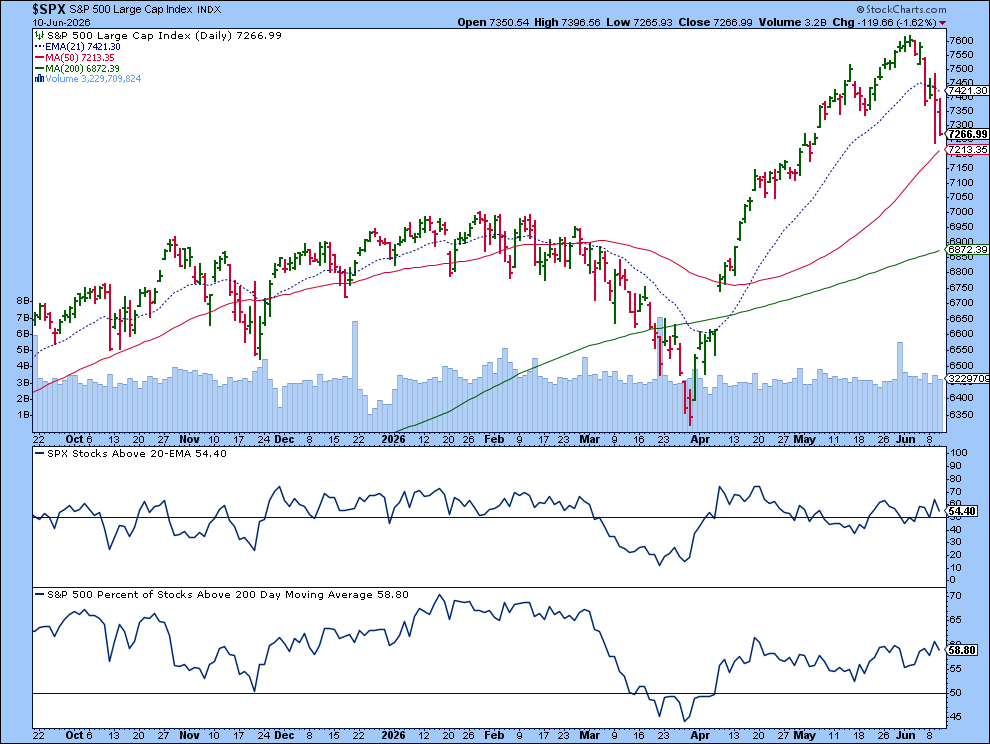
Below, the market‑breadth numbers show more than half of S&P stocks trading above their 20‑day EMA and above their 200‑day SMA. If these percentages fell below 50, it would signal narrowing breadth.
The May Consumer Price Index matched expectations, showing a 4.2% year‑over‑year rise. The recent sell‑off may be more linked to fresh U.S.–Iran tensions than to inflation numbers.
Tech stocks are also feeling the pressure. The Nasdaq Composite is close to its 50‑day SMA, just like the S&P 500. The index bounced off the SMA on Tuesday, then fell back to test it again.
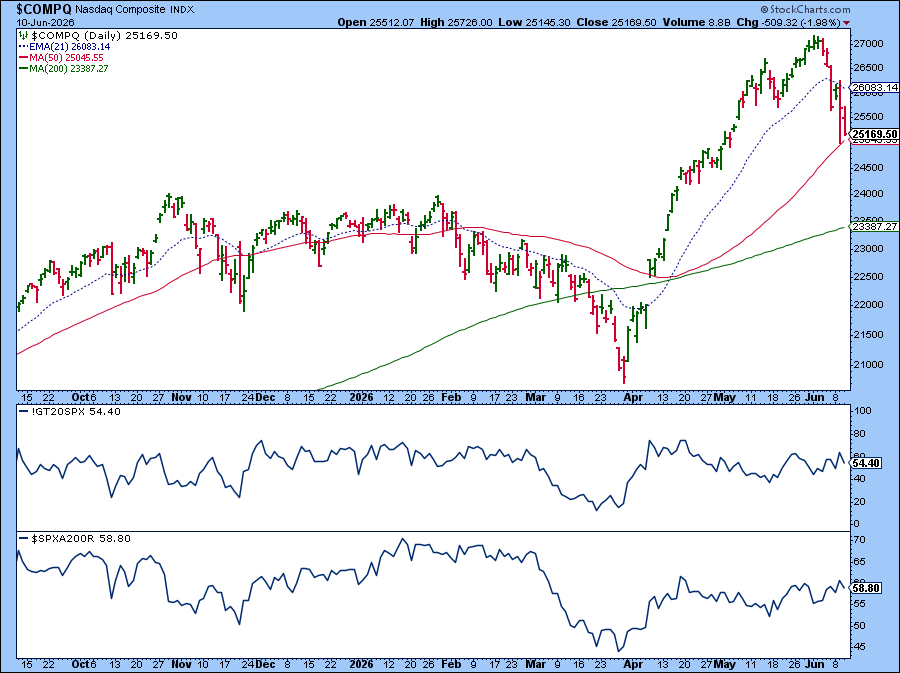
Even in the Nasdaq, the breadth numbers have not shrunk enough to cause panic.
One warning sign is the slowing momentum in semiconductor stocks, which have been a major driver of market gains. The VanEck Semiconductor ETF (SMH) broke below its 21‑day EMA. The chart shows the Relative Strength Index (RSI) turning down at the end of April while prices kept rising. If you had watched that divergence, you might have avoided a loss.
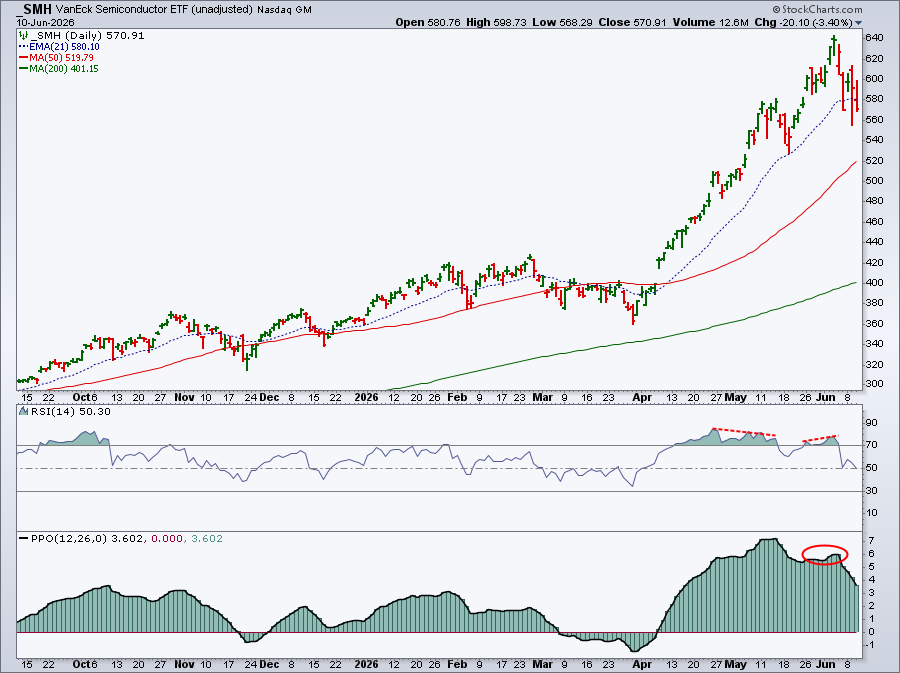
The Percentage Price Oscillator (PPO) also stayed flat after the May pullback, failing to reach earlier highs.
If the price bounces off the May low or the 50‑day SMA and the momentum turns up, the move could be a good entry point for the beaten‑down chip stocks.
The Dow Jones Industrial Average is holding a little better, staying above its 21‑day EMA, though it slipped below that line on Wednesday.
Investor fear is rising again. The Cboe Volatility Index (VIX) closed at 22.21, just above the 20‑point warning level.
Short‑term charts may look shaky, but longer‑term views—like the 20‑year monthly chart and the five‑year weekly chart—still show an overall uptrend.
All Eyes On Oil
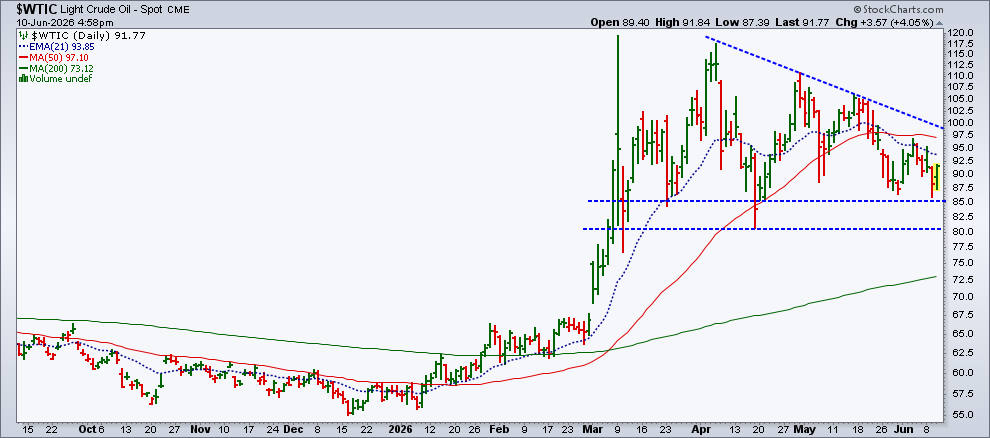
U.S.–Iran tensions keep oil in focus. Crude prices rose on Wednesday but are still moving inside a range.
Oil is far below its early‑March highs and is sliding lower. The chart below shows price approaching key support zones, but no clear breakout has happened yet.
Looking Ahead
Several headlines could move the market in the weeks ahead. Possible higher Fed rate hikes in 2026 may add pressure. More Middle‑East tension could raise fear. The upcoming SpaceX IPO could swing either way depending on sentiment.
Watch daily charts closely, but always step back to the weekly and monthly views before making big decisions.
Disclaimer: This article is for education only and is not financial advice. Always consider your own situation and talk to a professional before acting.
Source: Materials provided by https://articles.stockcharts.com.Note: Content may be edited for style and length.