

When a stock keeps moving higher for a long time, we need to watch for clues that the trend might be changing. This is true for many big companies, from chips to banks.
If prices keep climbing but the Relative Strength Index (RSI) starts to fall, it may mean the up‑trend is losing steam. This pattern is called a “bearish momentum divergence.”
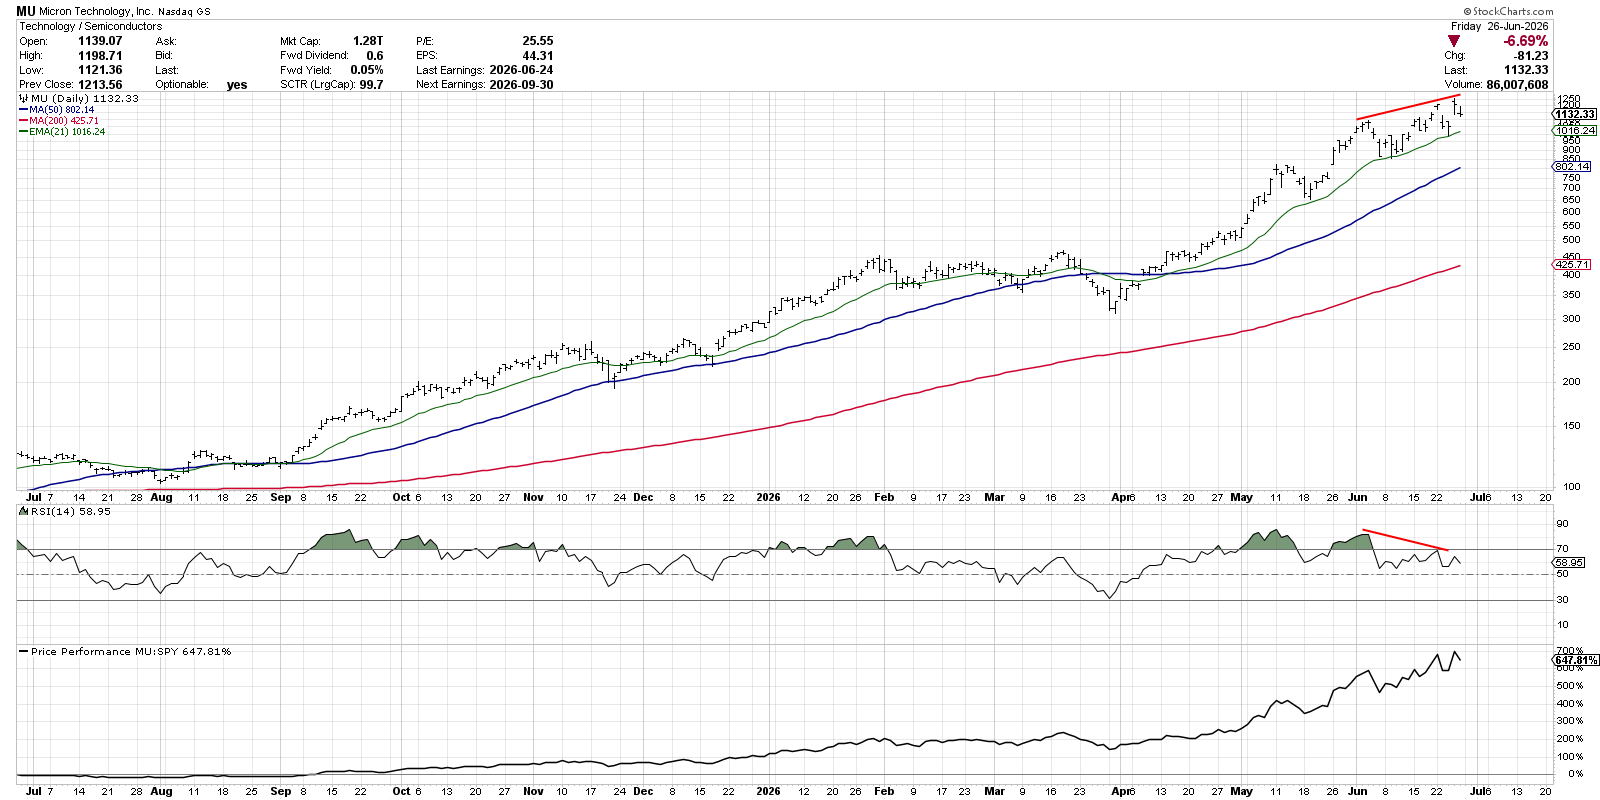
Micron (MU) shows a classic long‑term uptrend: higher highs, higher lows, and moving averages that tilt upward. In early June the stock hit a new high and the RSI went above 80. Later in the month the price made another high, but the RSI barely reached the 70 overbought line. The gap between price and RSI hints that the buying pressure is weakening.
Similar warning signs appear in other sectors. Morgan Stanley (MS) looks like a semiconductor chart because its moving averages line up in the same way and its relative strength is still strong.
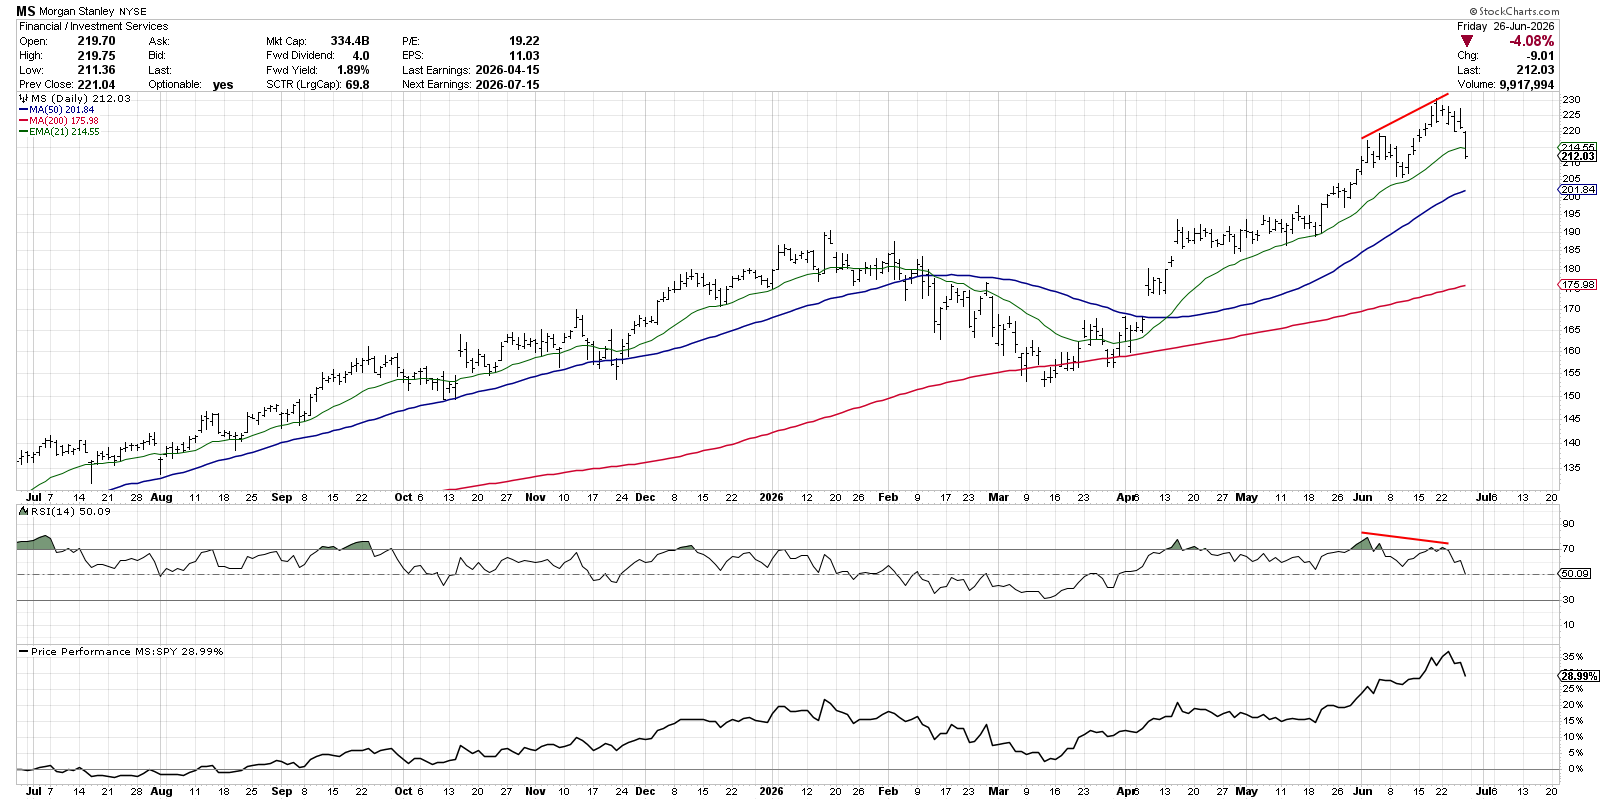
On Friday, the stock slipped below the 21‑day exponential moving average, joining other financial firms that fell. To tell if a divergence is serious, we watch the RSI. It should stay above 40 for a medium‑term uptrend. If the RSI drops under 40, the stock could be entering a distribution phase.
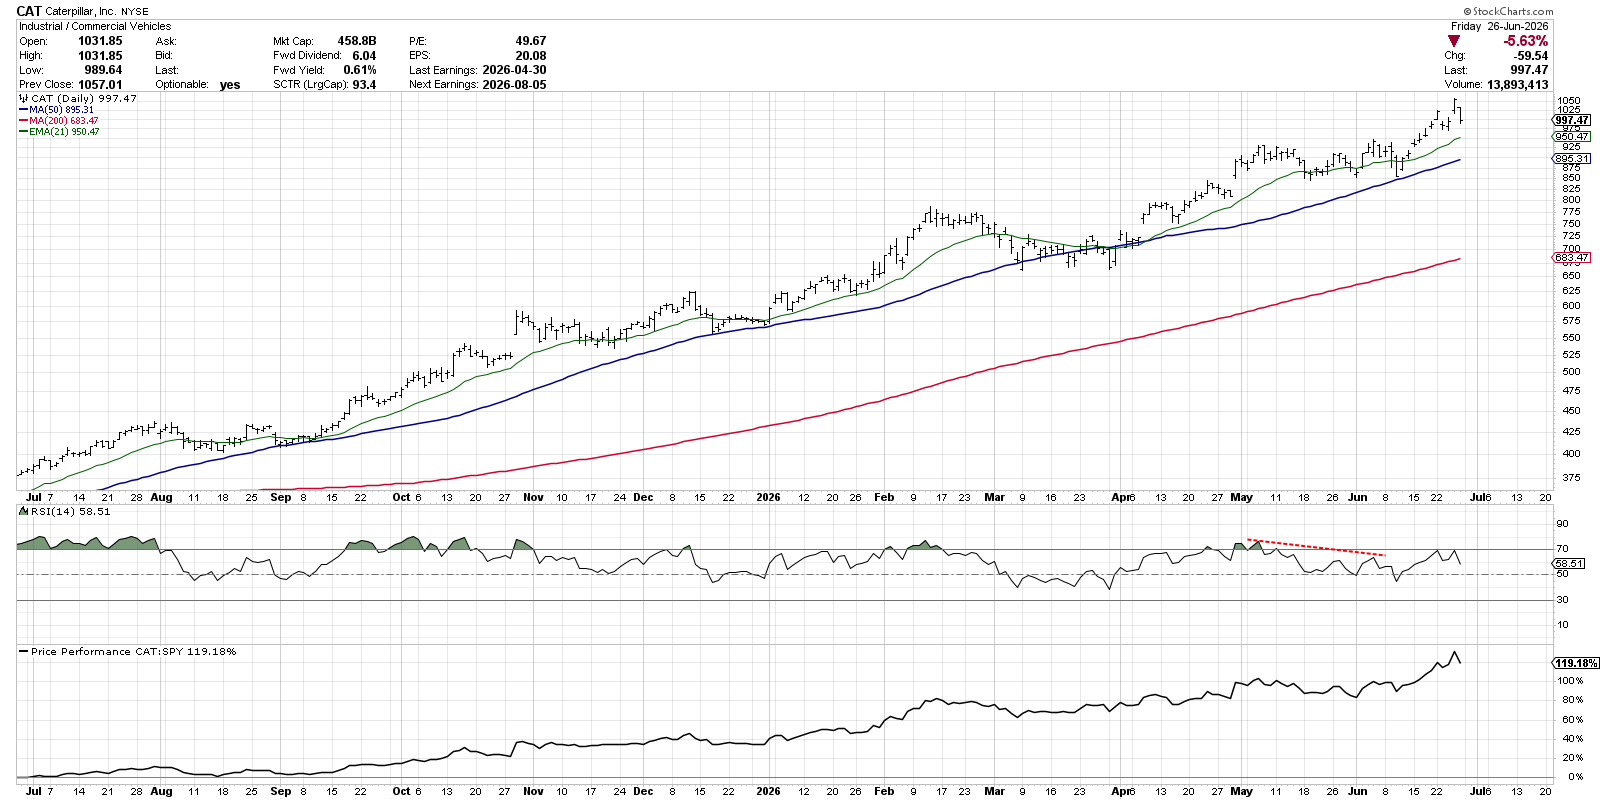
Caterpillar (CAT) offers another example. In May and June the price made higher highs while the RSI made lower highs, a classic bearish divergence. Yet in mid‑June the stock broke to a new 52‑week high and the RSI rose back to 70, showing fresh buying power and a possible continuation of the uptrend.
These bearish divergences remind investors to keep a close eye on momentum. When leaders start to pull back with weaker RSI readings, it can be an early sign of broader market weakness.
Source: Materials provided by https://articles.stockcharts.com.Note: Content may be edited for style and length.