

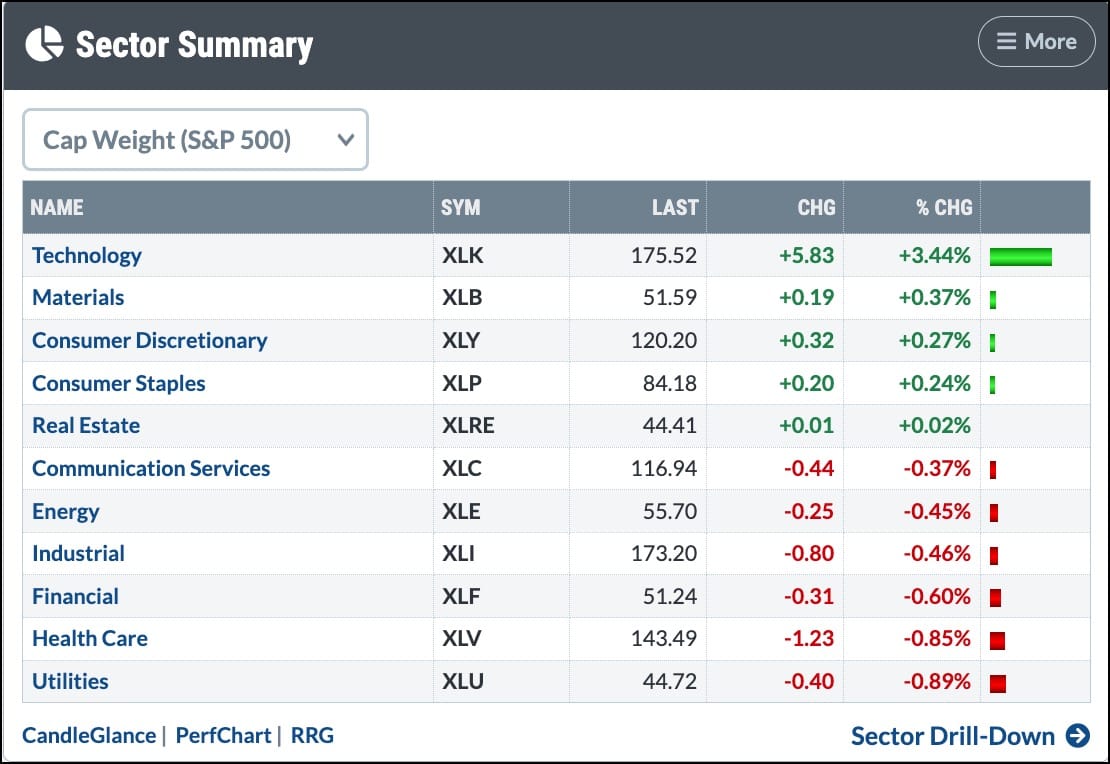
Investors are talking a lot about technology. On Friday, tech stocks went up a lot, while most other S&P 500 groups barely moved.
Here are the numbers from Friday, May 8, 2026: the Technology Sector SPDR (XLK) rose 3.4%, while the other 11 sectors were all below +0.4%.
How much does technology really affect the whole market? We looked at several charts to see the tech leadership, sector breadth, and possible warning signs.
What If the S&P 500 Had No Tech?
The ProShares S&P 500 Ex‑Technology ETF (SPXT) shows what the index would look like without tech stocks. The chart tells a clear story.
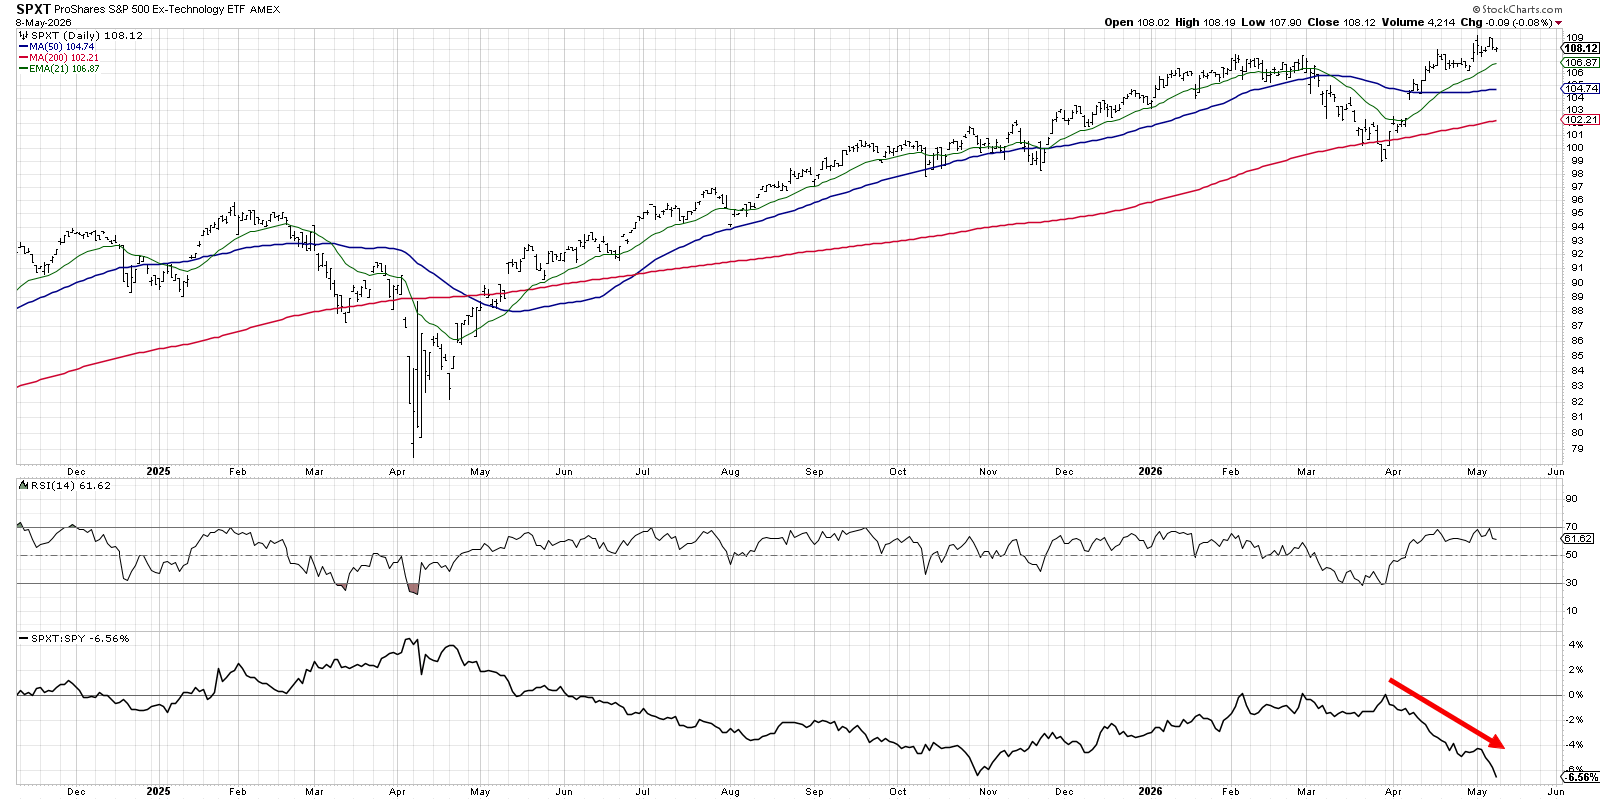
SPXT follows the S&P 500 but leaves out all the tech companies. When we look at the relative‑strength line at the bottom, we can see how it performed against the full index.
From April 2025 to October 2025 the line fell, meaning non‑tech stocks lagged behind tech. From late October to March 2026 the line rose, showing other sectors were catching up. In the last six weeks the line fell again, bringing us back to a tech‑driven market. Not owning tech has cost investors a lot.
Which Breadth Tools Show Tech Leadership?
The Bullish Percent Index (BPI) counts how many stocks are showing a bullish point‑and‑figure pattern. We looked at the BPI for three groups: the S&P 500, the Nasdaq‑100, and the S&P 500 Technology sector.
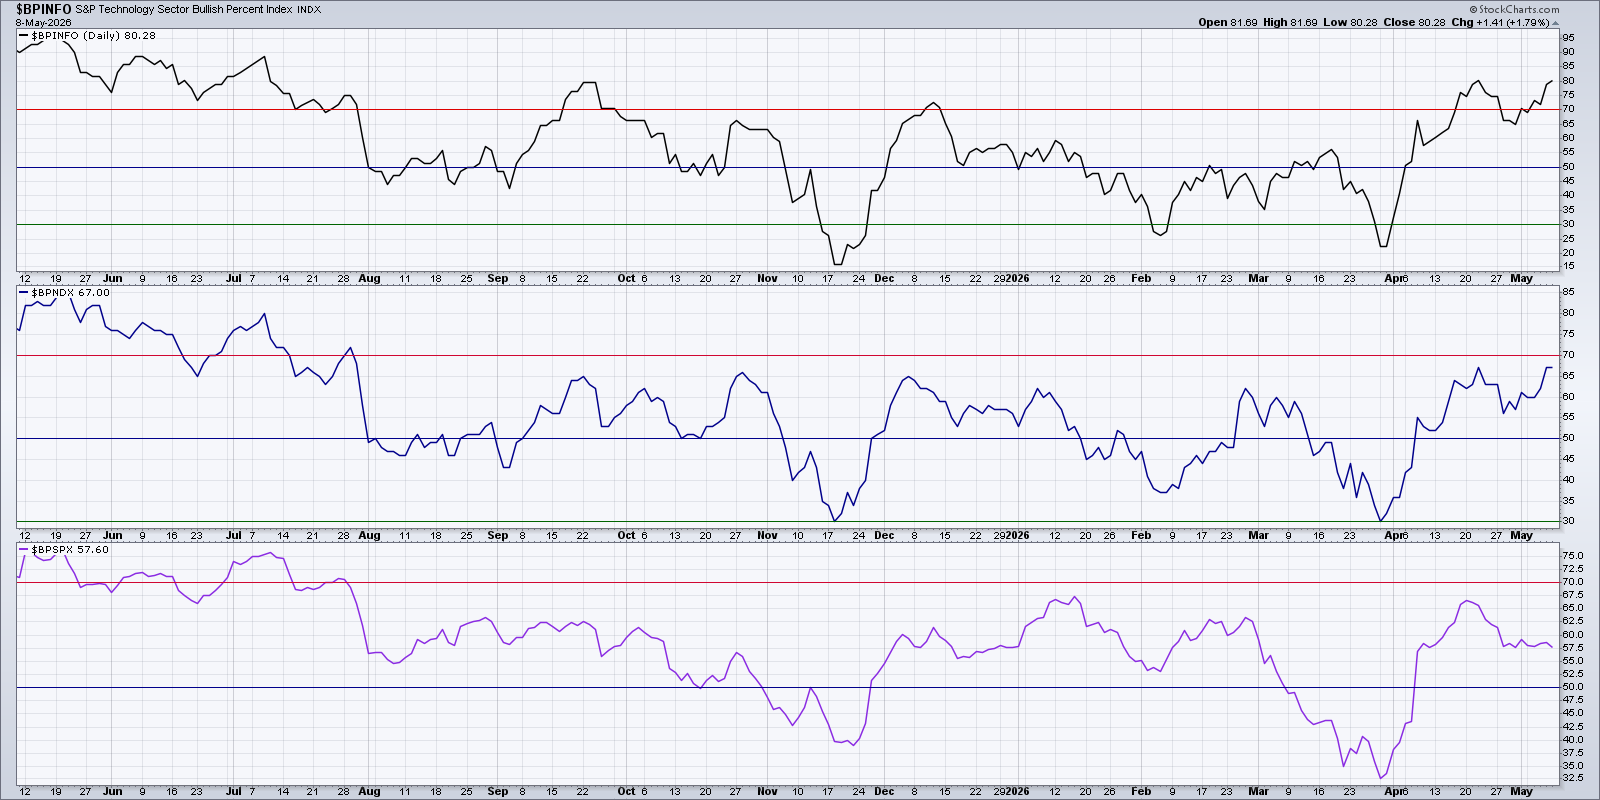
About 58% of all S&P 500 stocks are bullish, a number that has slipped recently. The Nasdaq‑100 shows a stronger 67% bullish rate. The tech sector tops the list with more than 80% of its stocks in a bullish pattern.
Another way to view breadth is to compare two ETFs: the equal‑weight Invesco S&P 500 Equal‑Weight Technology ETF (RSPT) and the cap‑weight Technology Select Sector ETF (XLK). The ratio of RSPT to XLK shows how each group performed over the past year.
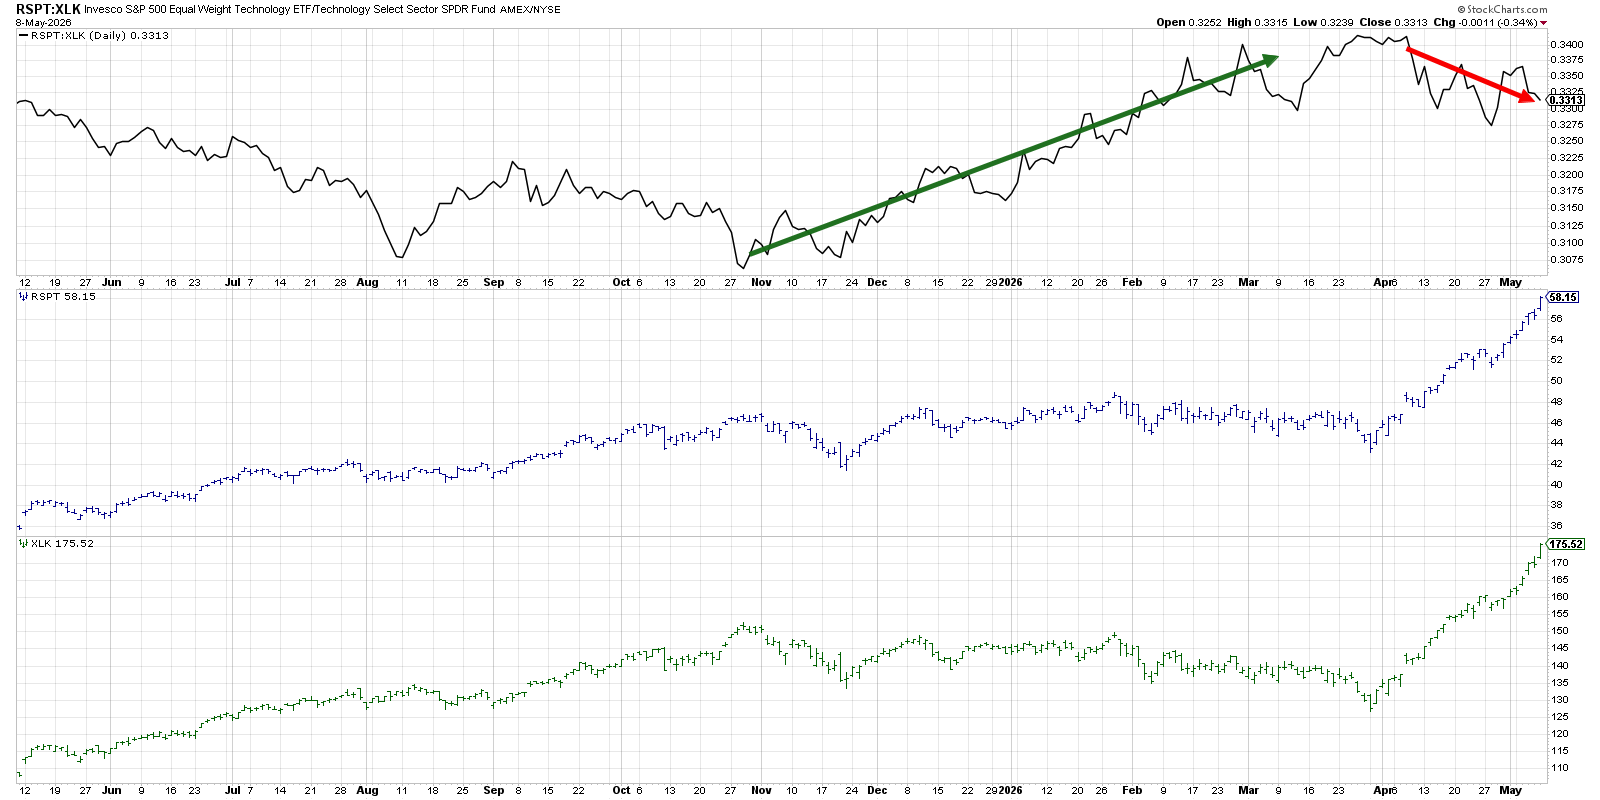
From late October 2025 to March 2026 the equal‑weight ETF out‑performed the cap‑weight version. After March, XLK pulled ahead, driven largely by big semiconductor names such as Micron (MU).
What About Other Tech Groups?
The semiconductor market has been especially strong. The VanEck Semiconductor ETF (SMH) broke out in early April and has stayed high ever since.
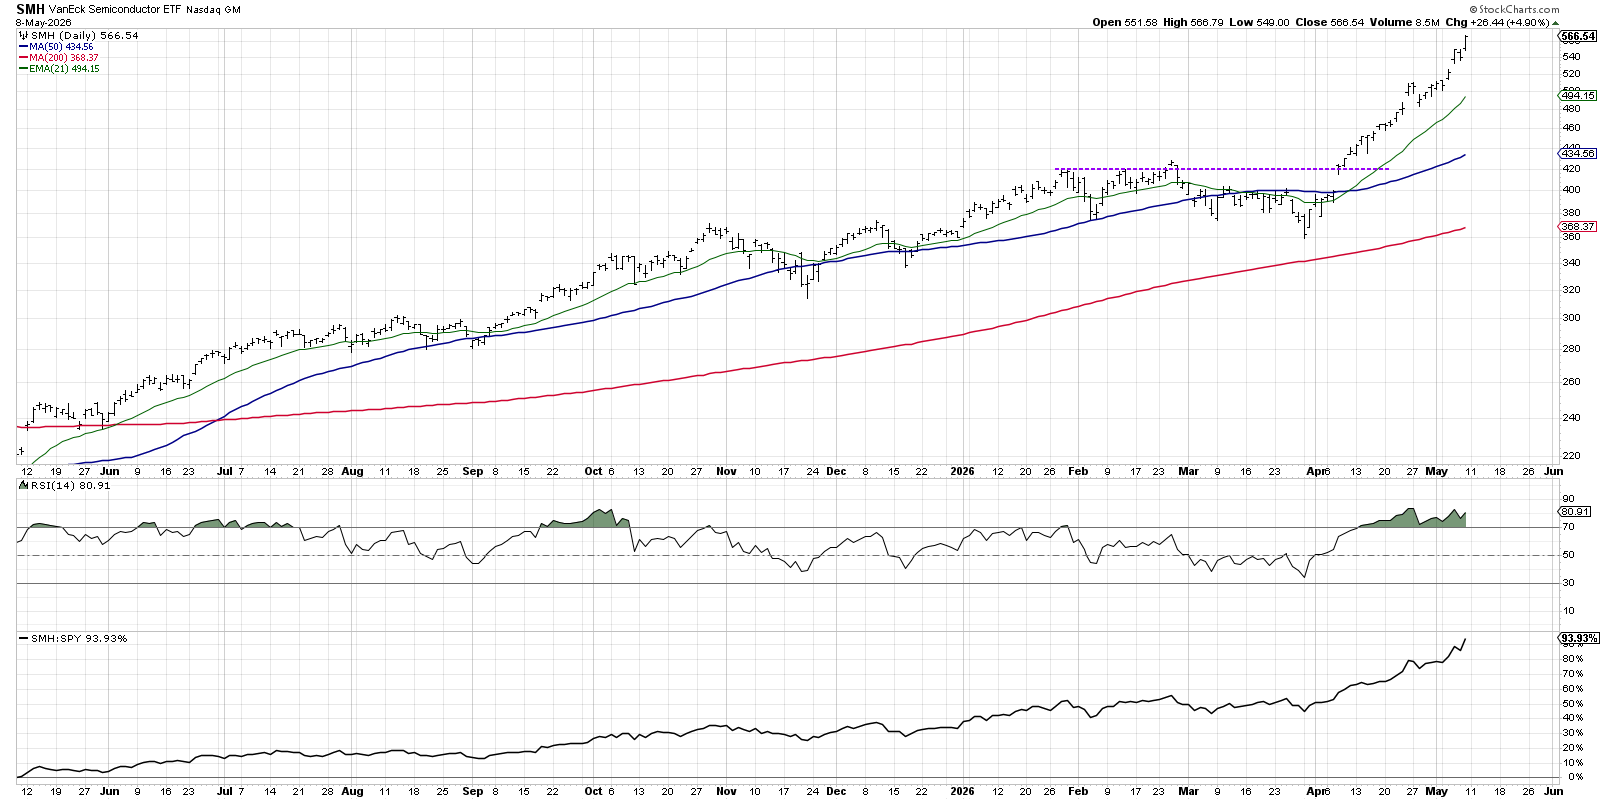
SMH is now in an overbought zone. All its moving averages (21‑day EMA, 50‑day SMA, 200‑day SMA) line up in a bullish shape. If the price falls below the 21‑day EMA, it could be an early sign that the uptrend is weakening. A pullback that pushes the RSI into the 40‑50 range would be a warning to watch.
Software stocks have been slower, but the iShares Expanded Tech‑Software Sector ETF (IGV) showed a nice bounce. The ETF broke above a key resistance level near $88 this week.
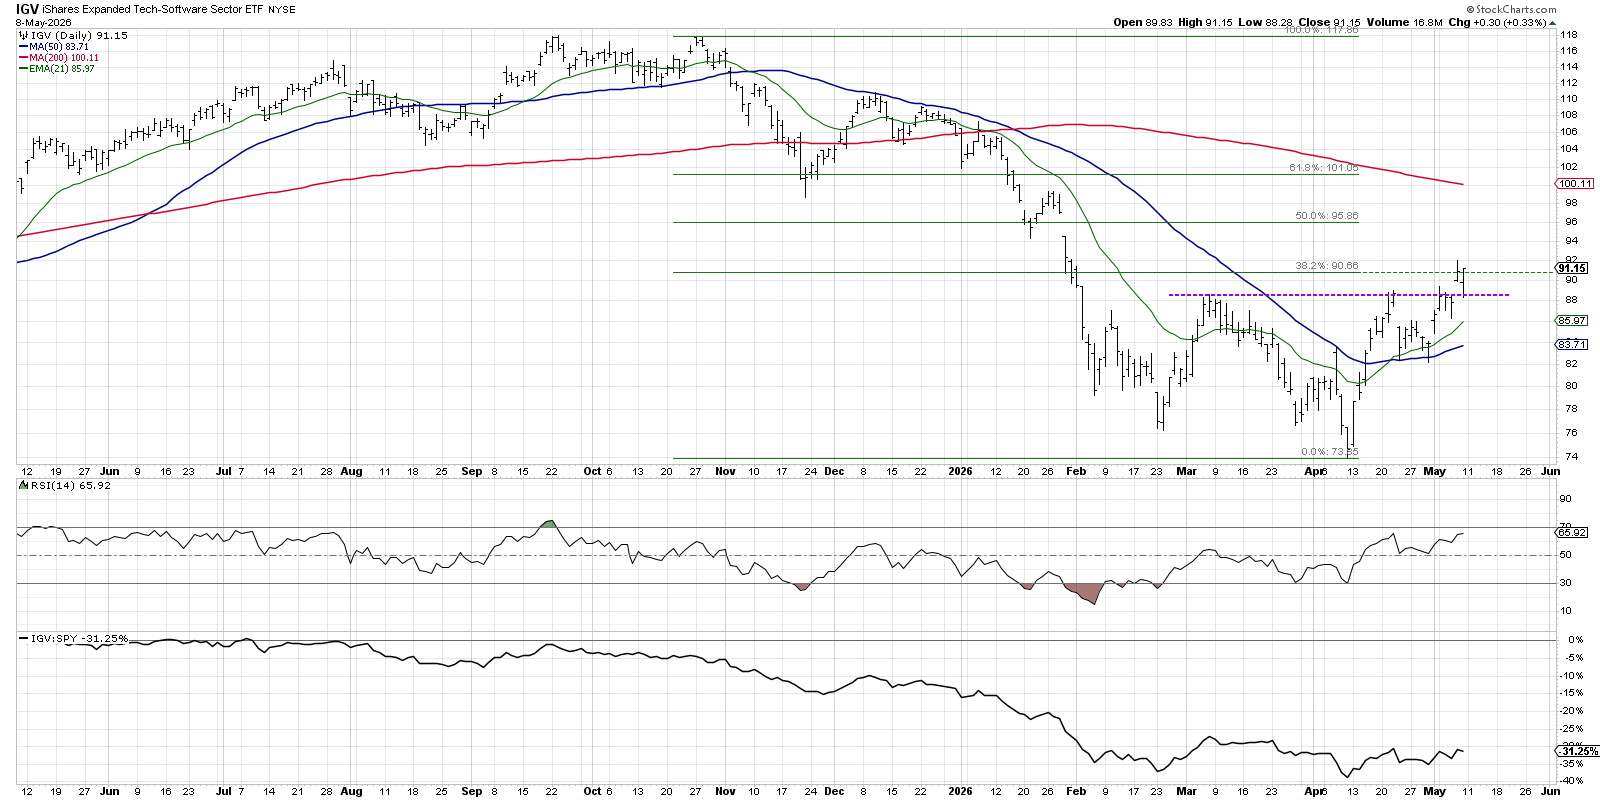
If IGV can stay above $88 and attract more buying volume, it may start a new growth phase for software companies.
In short, technology is still the main engine of the market in 2026. The data shows strong breadth, high ETF performance, and a few warning signs to keep an eye on.
Disclaimer: This article is for educational use only and does not constitute financial advice. Readers should evaluate their own situation and consult a professional before making investment decisions.
Source: Materials provided by https://articles.stockcharts.com.Note: Content may be edited for style and length.