

The S&P 500 closed the week with a new all‑time high after a price jump. The jump looks strong, but it will only matter if the market keeps moving up next week. If not, the gap could turn into a "gap‑and‑fail" pattern.
In this article we will see how price gaps help us read what investors feel. We will look at examples of both bullish and bearish gaps and then point out three recent gaps that need confirmation.
Gap and Run vs. Gap and Fail
Oracle (ORCL) shows several gaps on its daily chart. Some gaps are followed by more buying – we call those "gap and run". Others are followed by selling – those are "gap and fail".
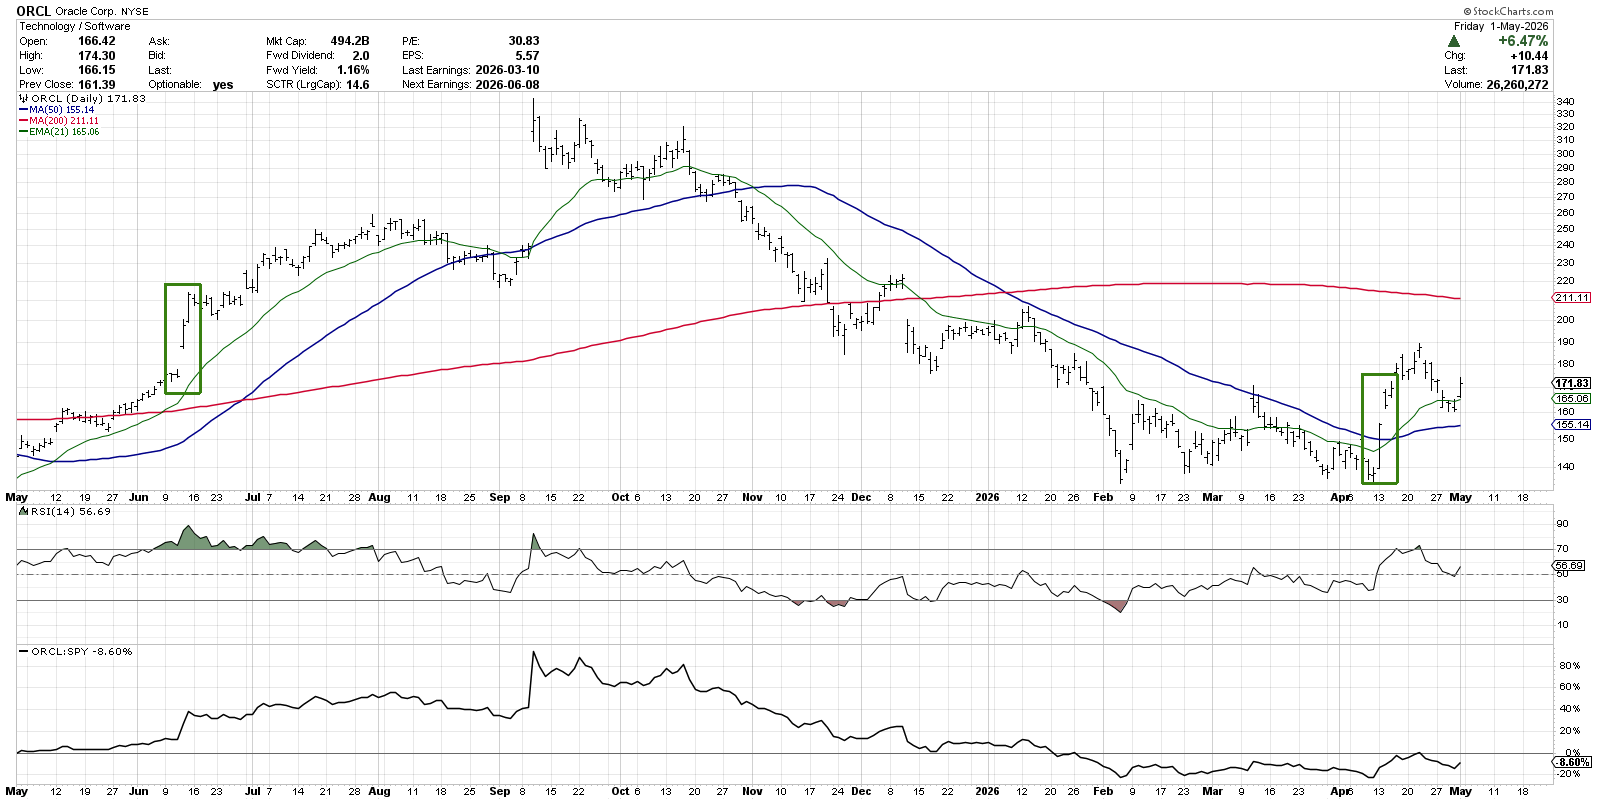
In mid‑April, Oracle bounced off support near $140, closed above its 50‑day moving average and then jumped higher on April 14. Buyers kept coming, pushing the price up after the gap. This shows optimism – traders are willing to pay more.
A similar "gap and run" happened in June 2025 during a strong uptrend. After the gap, buying continued, the stock consolidated a bit, then the uptrend resumed and reached a peak in September.
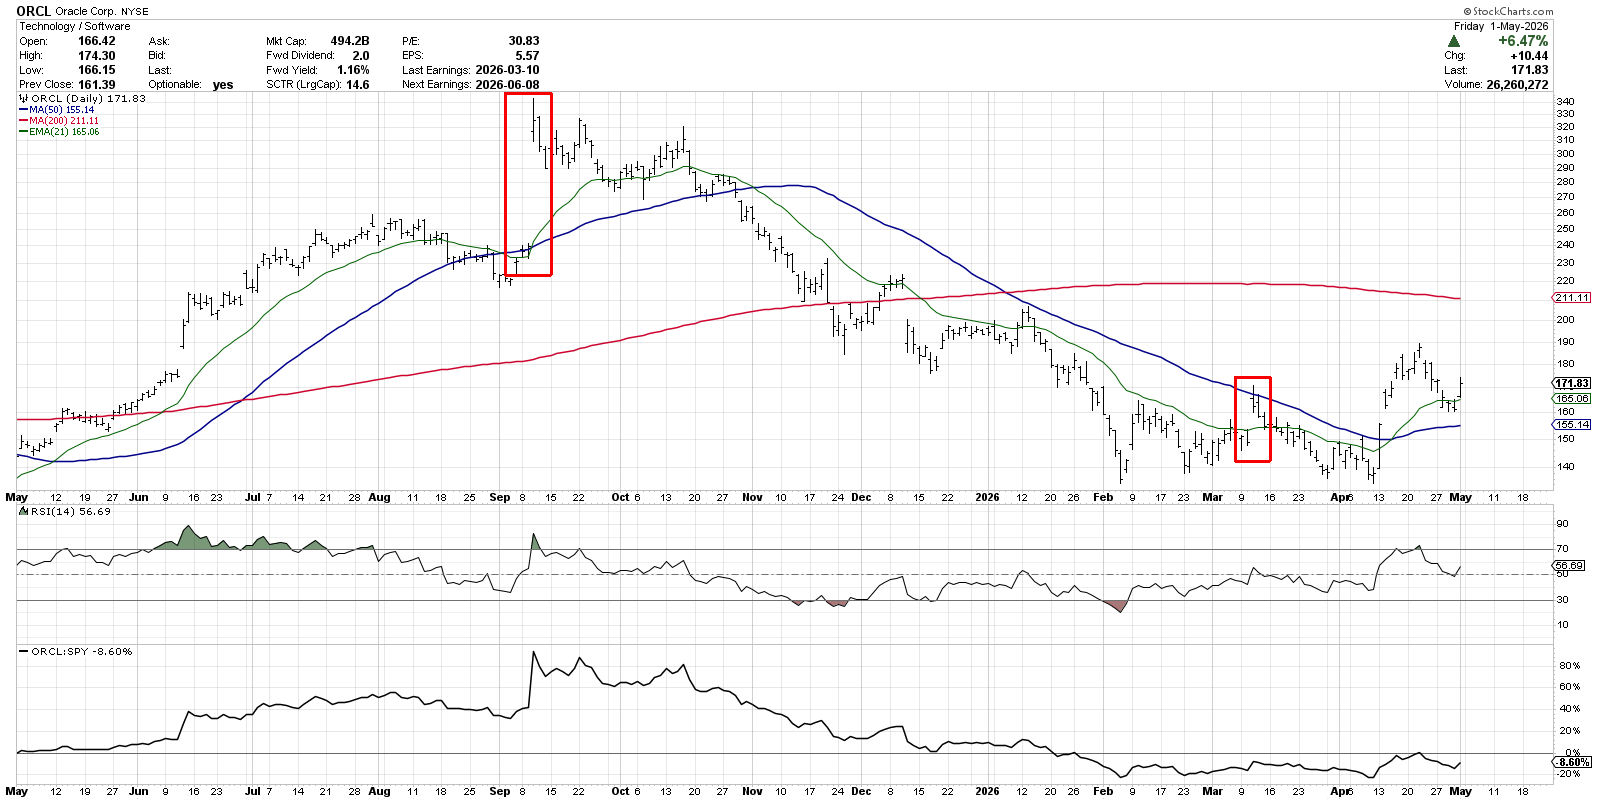
Later in September 2025, Oracle made a gap higher but immediately entered a short distribution phase. Sellers came in right after the gap, showing a lack of buying power. This "gap and fail" signals a bearish outlook because demand is weak.
Big‑Name Gaps This Week
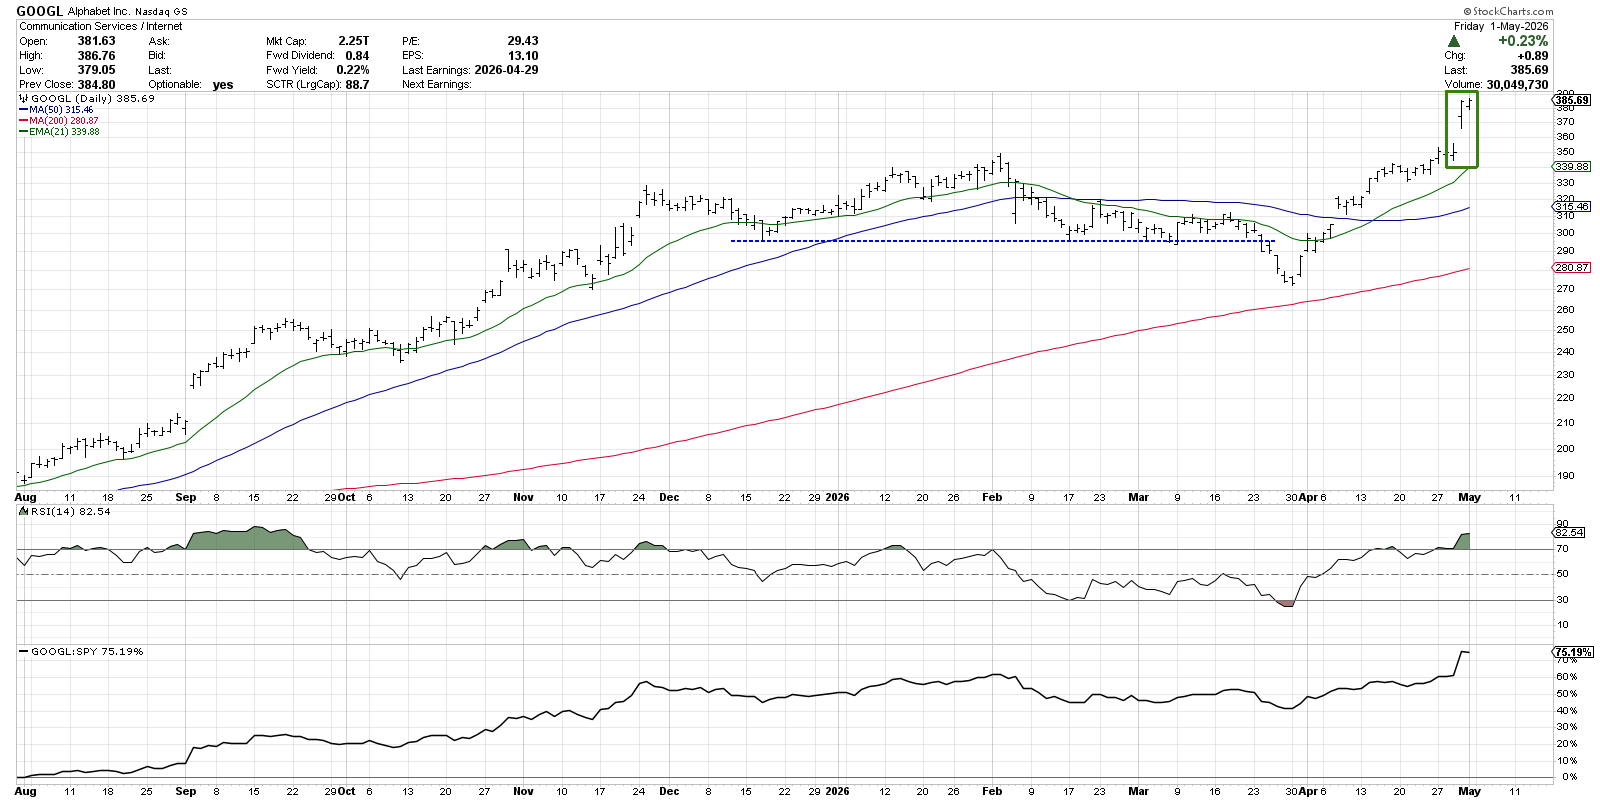
Alphabet (GOOGL) jumped after its earnings report, closing near a new high above $380. The next day showed a higher high and a higher close, suggesting buying strength. If the price drops early next week, the gap could become a support level around $165.
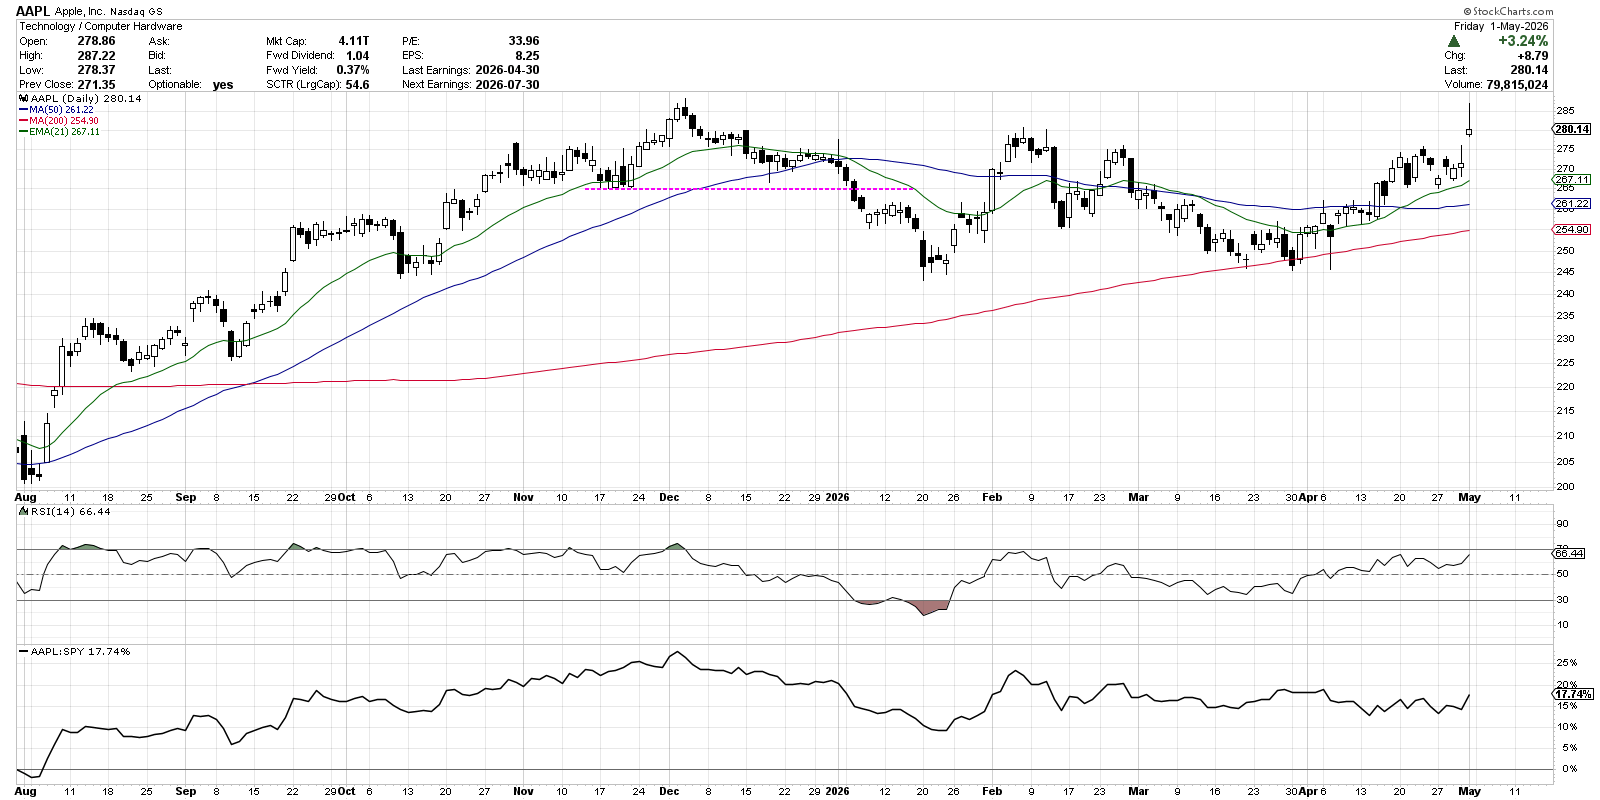
Apple (AAPL) also gapped higher after a strong earnings beat on Thursday. However, the candle closed near the day’s low, forming a "shooting star" pattern that often hints at short‑term weakness. The gap may act as support, but the candle suggests a possible "gap and fail" next week.
Will the S&P 500 Follow a Gap‑and‑Fail?
The S&P 500 also shows a small gap and a shooting‑star candle, with the open and close near the low of Friday’s session. The 21‑day exponential moving average sits just above 7000. A short pull‑back early next week could test the 7050 level, which aligns with that average.
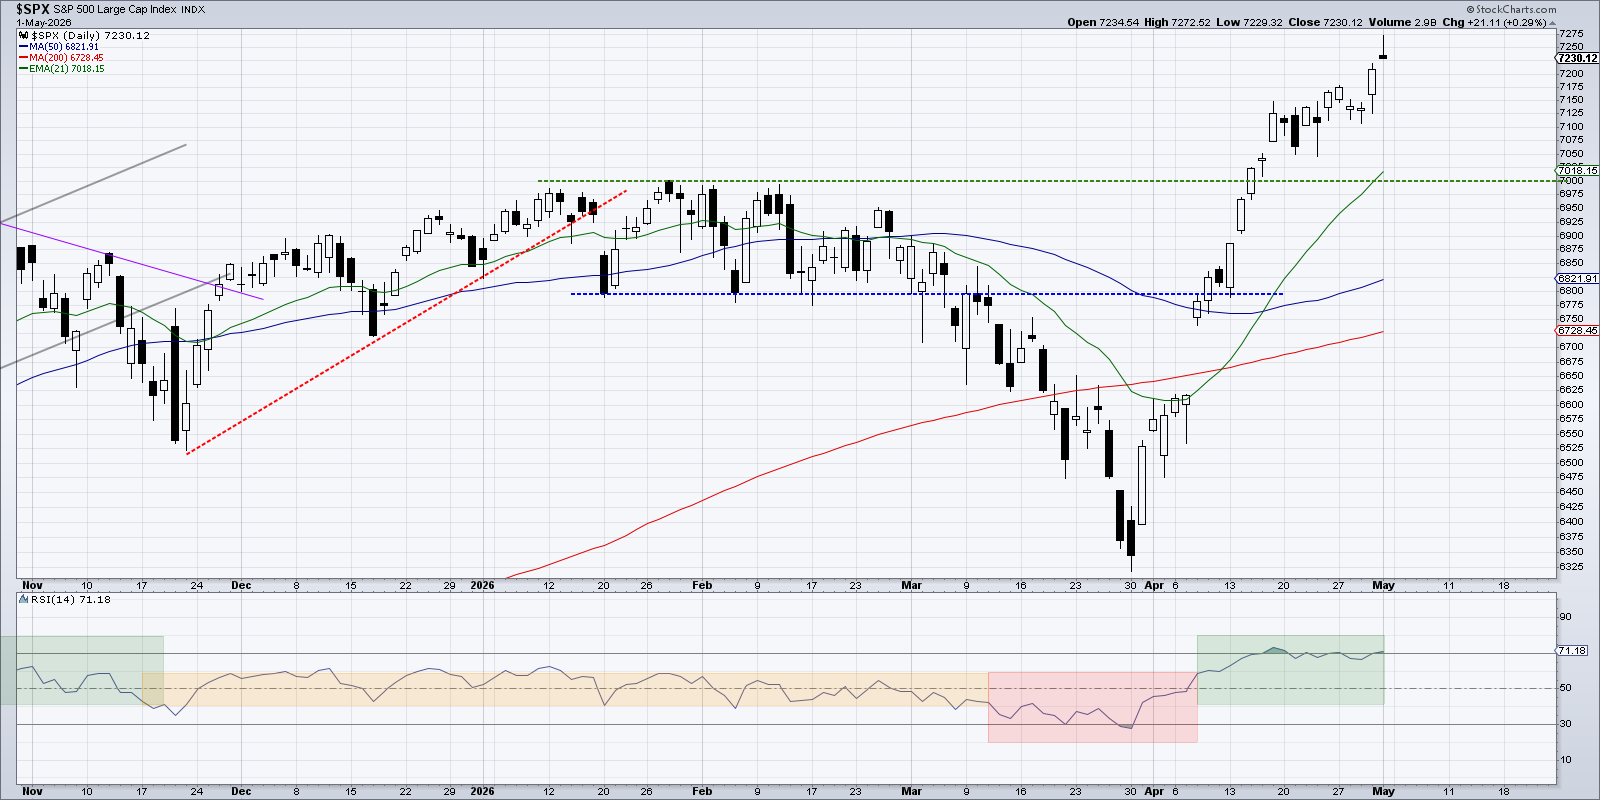
If the market holds the gap and moves higher on Monday, it would confirm a "gap and run" and give the index a clean bill of health. So far, optimism has been strong, and a confirmed run could push the index to even higher levels.
Disclaimer: This material is for educational purposes only. It is not financial advice. Always consider your own situation and consult a professional before acting on any investment ideas.
Source: Materials provided by https://articles.stockcharts.com.Note: Content may be edited for style and length.