


Building a portfolio that beats the S&P 500 is hard. Even experienced managers rarely stay ahead over many years.
At EarningsBeats.com we have good quarters and bad quarters, but our method stays the same. By the latest close, our model portfolio had almost twice the return of the S&P 500, showing the process can work.
Successful portfolios share one trait: they own several stocks that show strong relative strength. In plain words, you need the leading stocks from sectors that are beating the market.
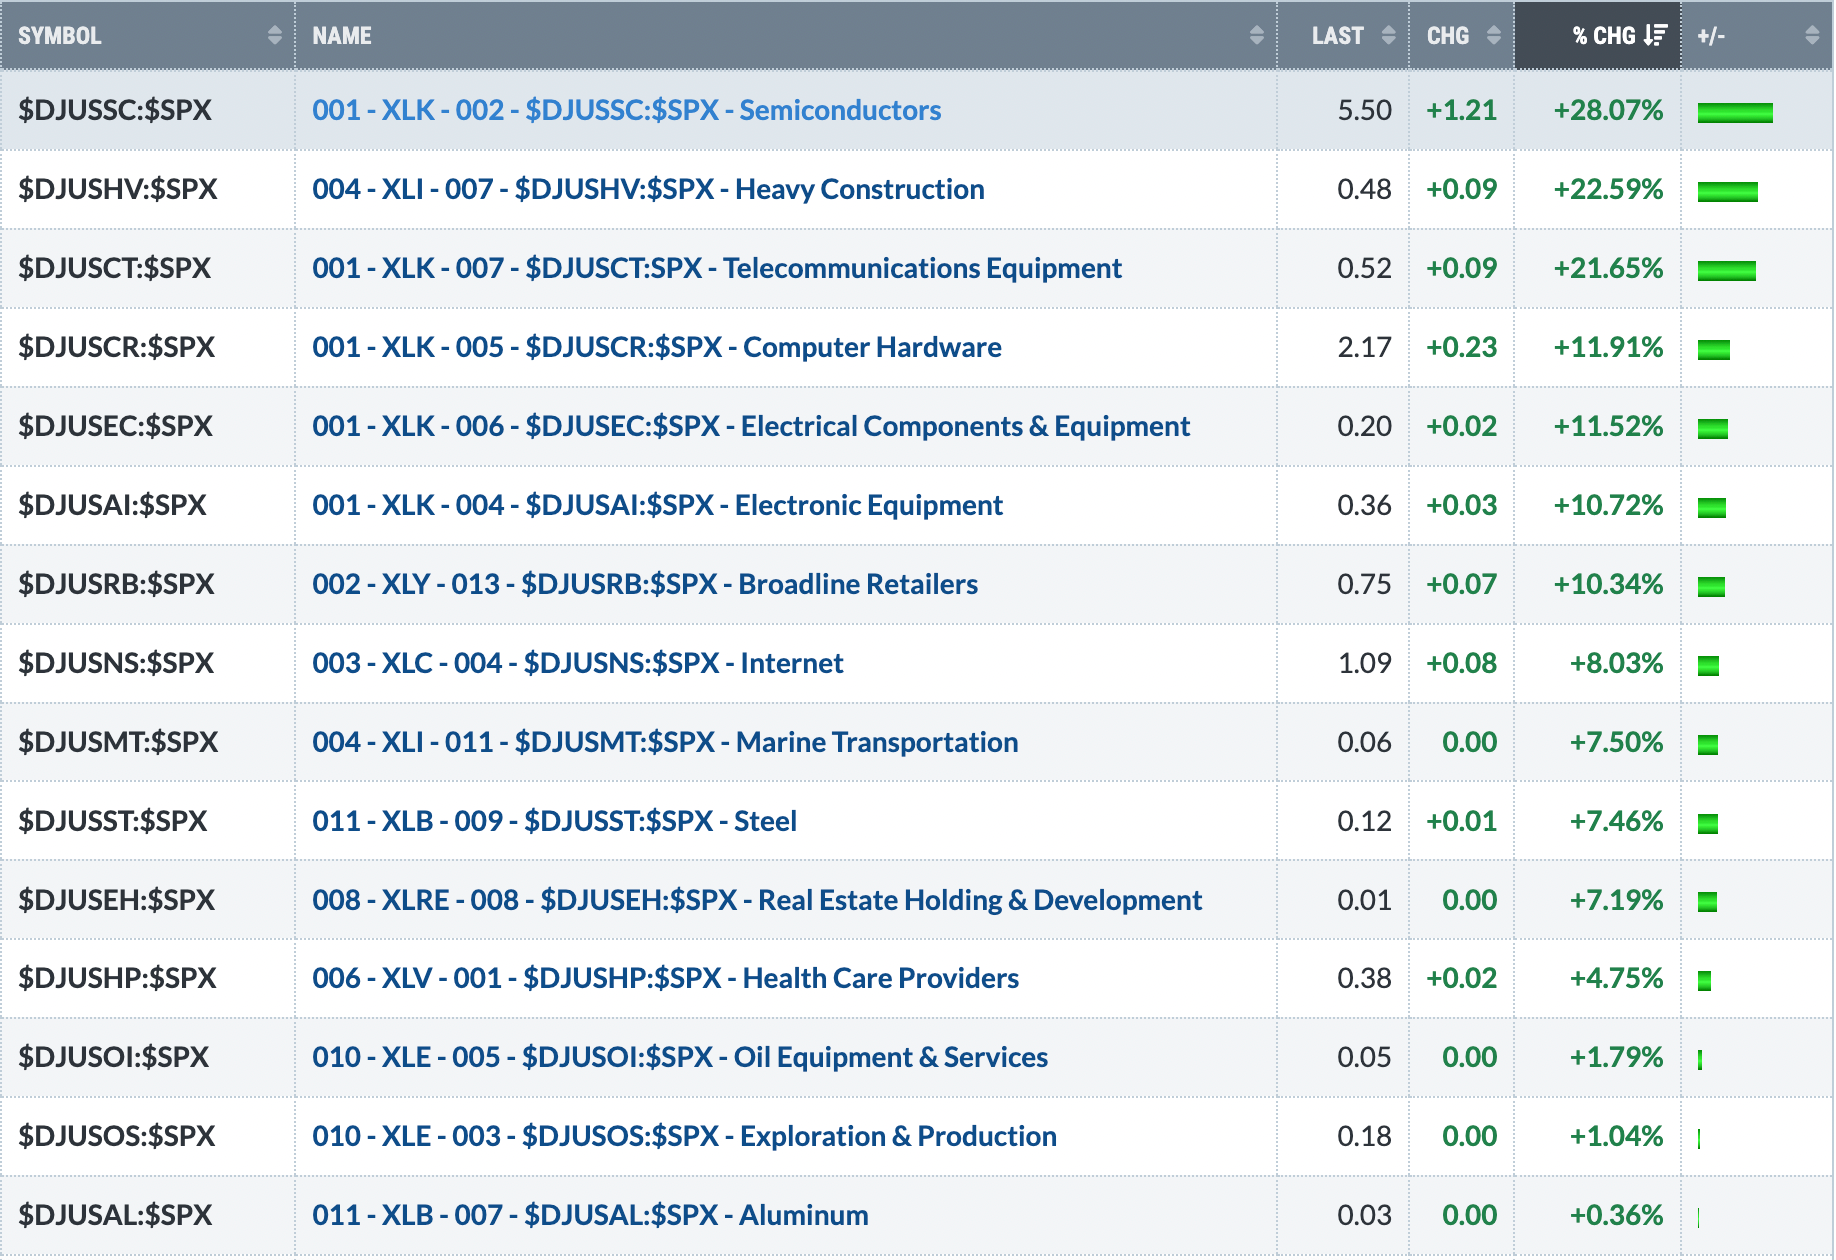
During the most recent quarter, beating the S&P 500 was almost impossible unless you heavily weighted technology, especially semiconductor stocks.
There are 11 sectors and over 100 industry groups. In the last three months, only one sector outperformed the index.
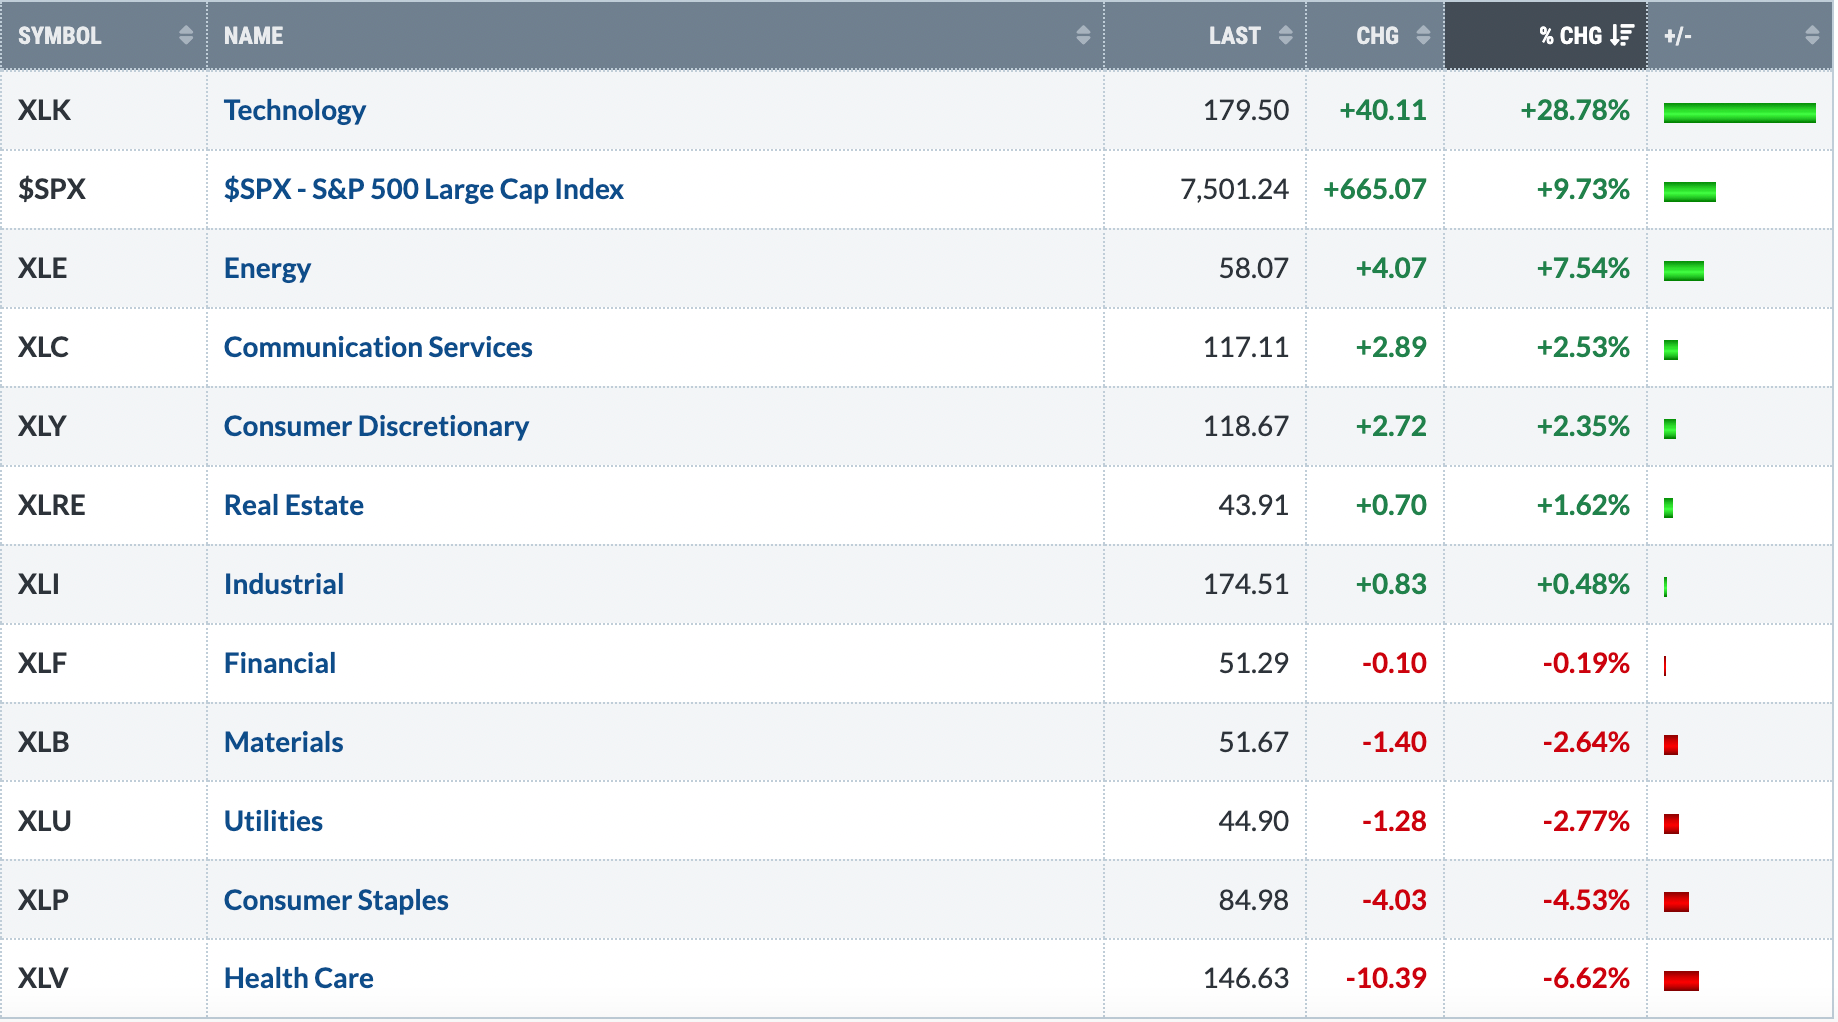
Technology crushed the benchmark. If you gave this sector a big weight, you had a chance to win. Otherwise, the market was tough.
Only 15 industry groups beat the S&P 500 in the same period. That means most of the 100‑plus groups are lagging behind. Simple math shows most diversified portfolios will underperform.
Our quarterly portfolios—Model, Aggressive, and Income—contain many tech stocks, but not enough to dominate. With only three trading days left in the quarter, the Aggressive portfolio holds a slight edge, while the Model and Income portfolios trail the benchmark.
We stick to a proven routine. Every quarter we pick the strongest stocks from leading industries and hold them for the next 90 days, then repeat the process. This approach has produced solid results since 2018.
Free LiveStream Event
For the first time we will share our whole process in a live webcast called “5‑Step Process To Trade With More Confidence.” The session will take place on Saturday, May 16 at 10:00 am ET.
Even if you can’t watch live, registering will give you a recording to view later. Sign up to reserve your spot.
Happy trading!
Source: Materials provided by https://articles.stockcharts.com.Note: Content may be edited for style and length.