

Indian stock markets moved mostly sideways this week. The Nifty stayed inside a 542‑point range, ending with a small rise of about 0.3 %. Market nerves cooled down, and the India VIX fell by almost 5 %.
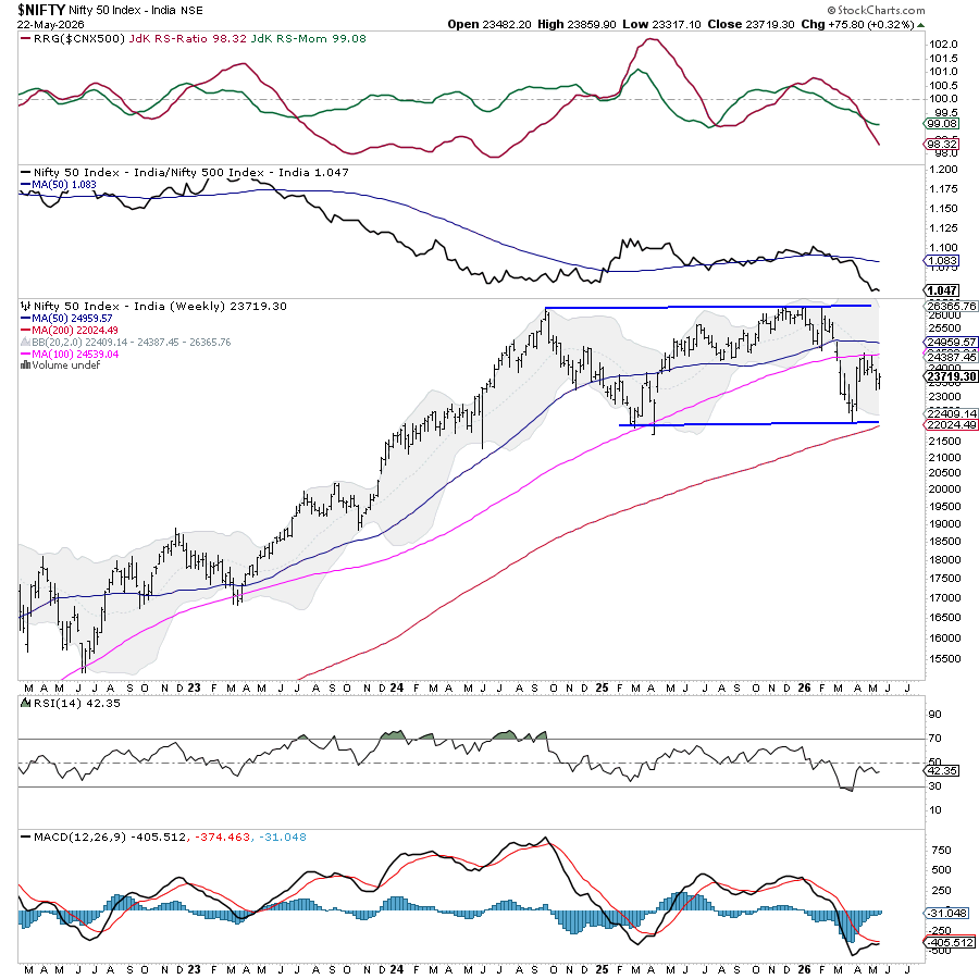
The broader picture is still cautious. The index is stuck just below an important resistance zone around 23,800‑23,850. To break out, the Nifty must close above this level and stay there. Until then, it will likely keep bouncing inside the same band.
Recent buying helped the market calm down, but the lack of strong follow‑through shows the rally is fragile. A clear move above 23,800 could spark short covering and lift the short‑term trend. If the price stalls, sellers may return.
Next week is shorter because of the May 28 holiday for Eid. Trading volumes may be light, and stock‑specific moves could dominate. Watch the index closely around the 23,800 mark. Immediate resistance sits at 23,800 and 24,050, while support lies near 23,500 and 23,350.
The weekly Relative Strength Index is about 42, indicating a neutral stance. Momentum is still weak, and the RSI has not turned bullish.
The weekly MACD stays below its signal line, keeping a bearish tone. However, the histogram is shrinking, hinting that the downside pressure may be easing.
On the chart, the Nifty sits below its 20‑week moving average (around 24,244) and the 100‑week average (about 24,540), which act as strong caps. The longer‑term 200‑week average near 22,025 remains supportive, keeping the overall trend upward.
For the coming days, traders should be selective and focus on individual stocks. Hold off on aggressive buying until the Nifty decisively closes above 23,800. As long as the index stays above the 23,300‑23,350 zone, there is no major technical damage. Protect gains, avoid heavy leverage, and manage risk carefully.
Sector Analysis for the Coming Week
We looked at how different sectors performed compared to the broader market (NIFTY 500). The chart below shows their relative strength.
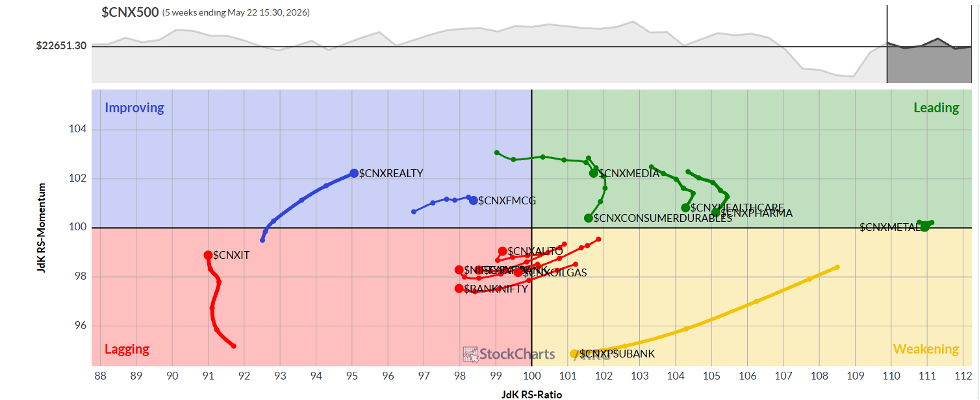
Metal, Mid‑Cap 100, Energy, Pharma and Media sectors are in the leading quadrant, suggesting they may beat the broader market.
Power, Infrastructure and PSU Bank indices have moved into the weakening quadrant, indicating possible slower performance.
Bank‑related and Financial Services groups sit in the lagging quadrant, which may underperform. Auto and IT sectors are also lagging but showing signs of improvement.
FMCG and Realty indices appear in the improving quadrant, hinting at gaining momentum.
Note: These relative rotation charts show how groups of stocks move compared to the market. They are not direct buy or sell signals.
Source: Materials provided by https://articles.stockcharts.com.Note: Content may be edited for style and length.