

Broadcom’s shares (AVGO) just passed the previous record set in December 2025. The big question is whether this rise will keep going or if it is the final push of a longer growth story.
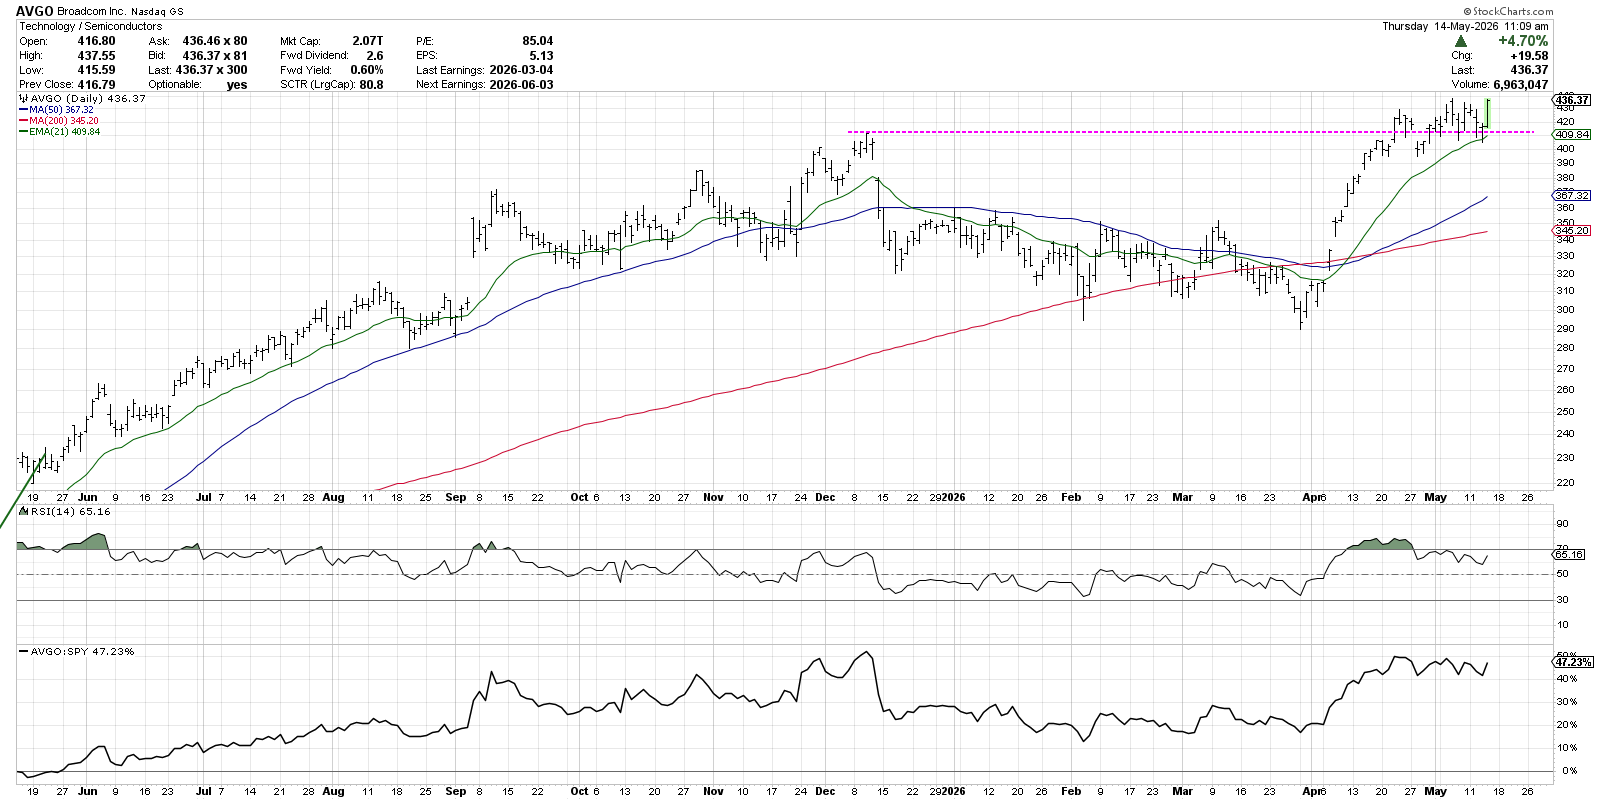
Even though the price looks impressive, the momentum indicator tells a different story. A bearish momentum divergence is forming, which could turn the rally into a sharp top.
How Price Breakdowns Confirm a Top
A bearish momentum divergence can end in two ways. If the price keeps climbing and the Relative Strength Index (RSI) moves higher, the rally may continue. If the RSI stays weak, the price often falls, confirming a top.
Oracle (ORCL) showed the second outcome. After the RSI failed to reach strong overbought levels, the stock fell below key moving averages.
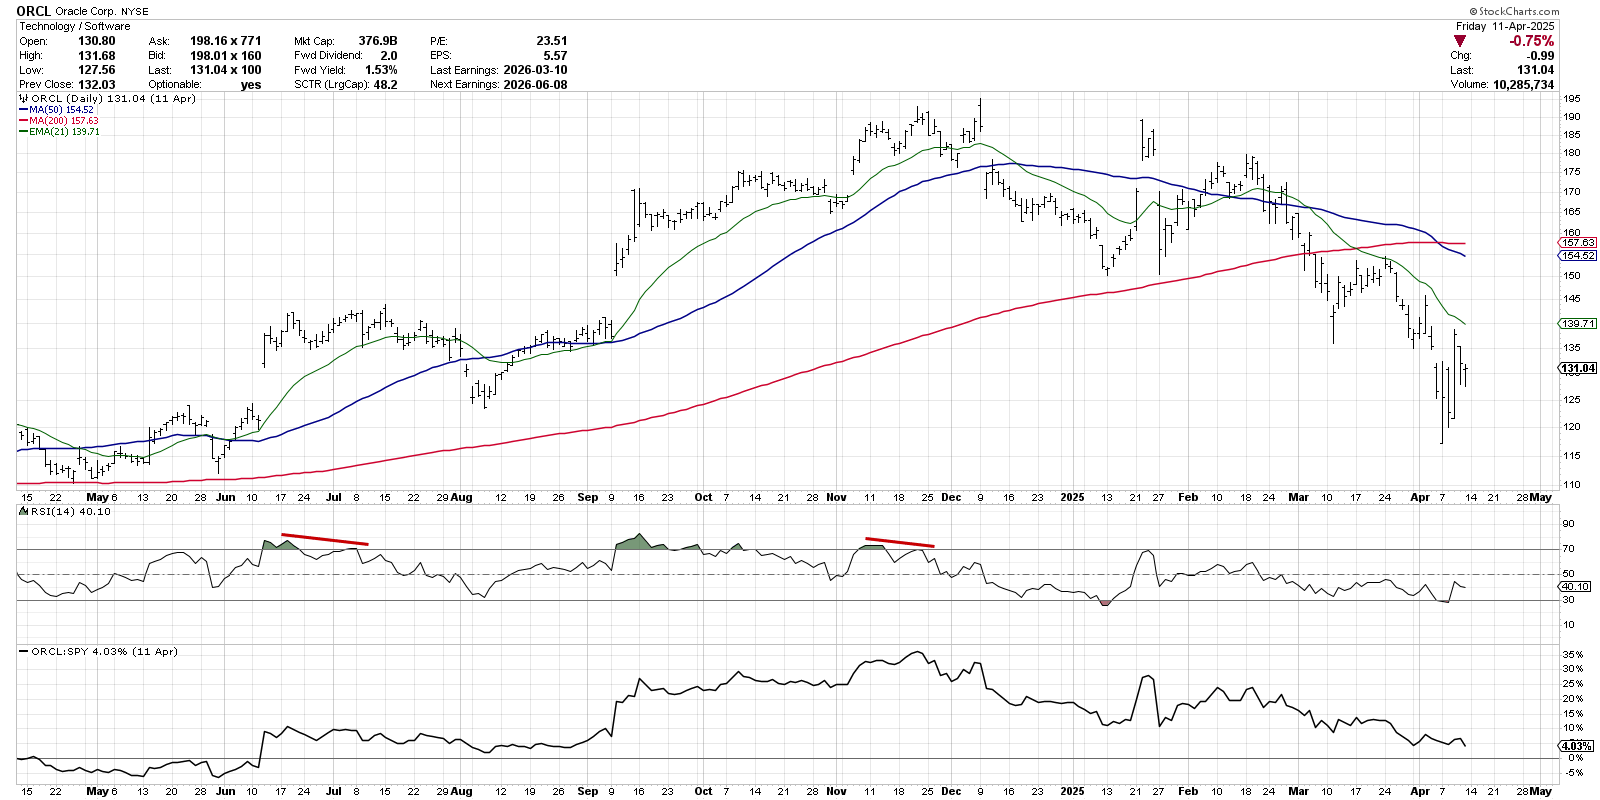
In mid‑2025, Oracle made higher highs, but the RSI never topped the overbought zone. The price then slipped below the 21‑day EMA and later the 50‑day SMA, confirming a downtrend.
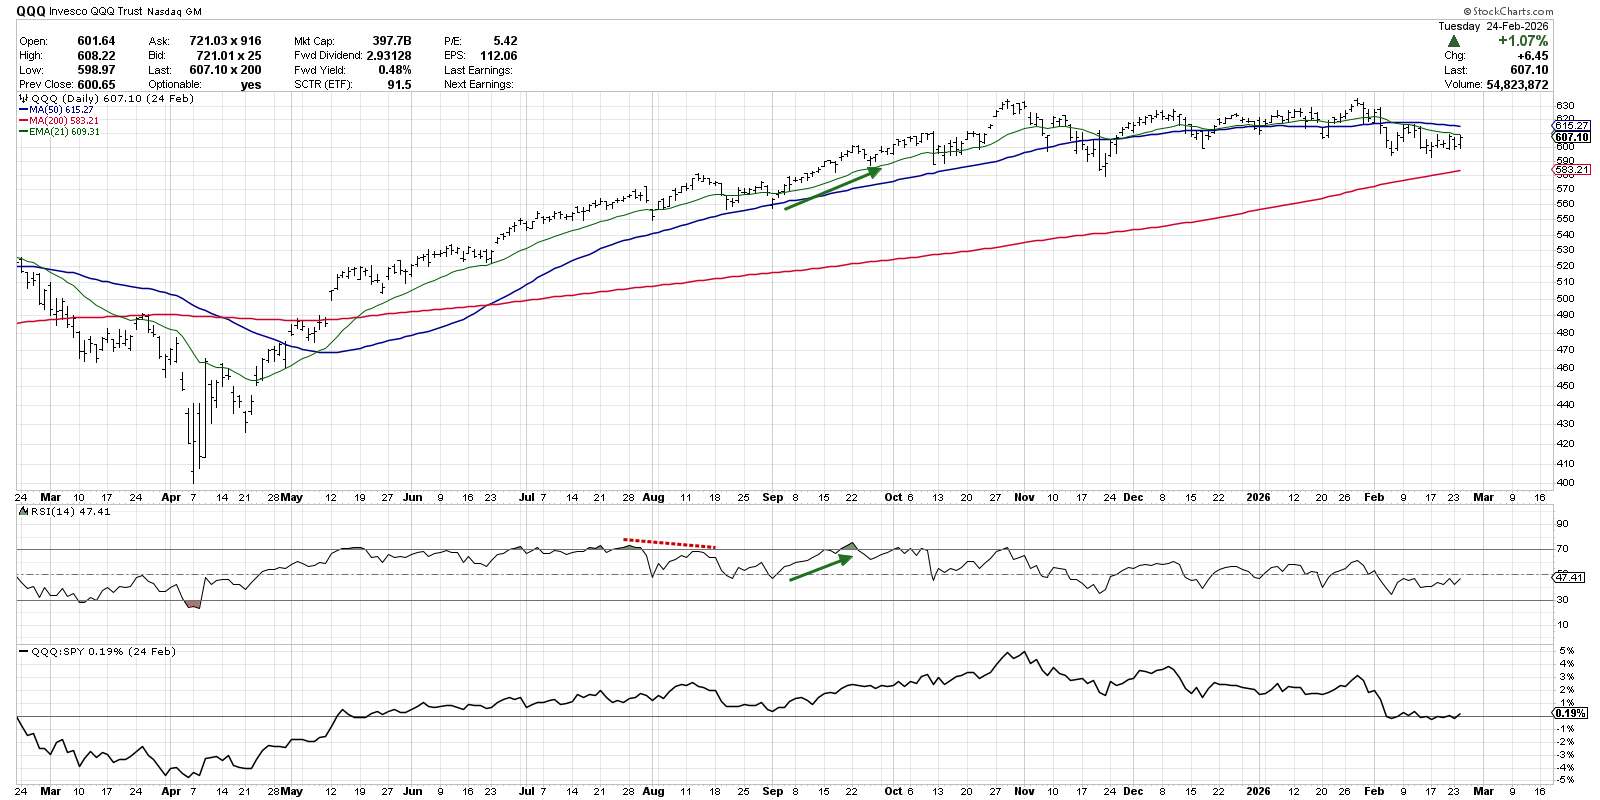
When Stronger Momentum Signals a New Uptrend
The Nasdaq‑100 (QQQ) provides a bullish contrast. In summer 2025 the index made a new high while the RSI fell, creating a divergence. After a brief pullback to the 50‑day average, the price resumed its rise and the RSI moved above 60, confirming renewed strength.
What the Broadcom Chart Is Telling Us
Looking at Broadcom now, the RSI is below the 70 level while the price sits just above the 21‑day EMA. Two paths are possible:
- Price climbs higher and the RSI rises above 70 – the divergence disappears and a new accumulation phase may begin.
- Price breaks below the 21‑day EMA – the next target could be the 50‑day moving average, and the RSI would likely confirm a distribution phase.
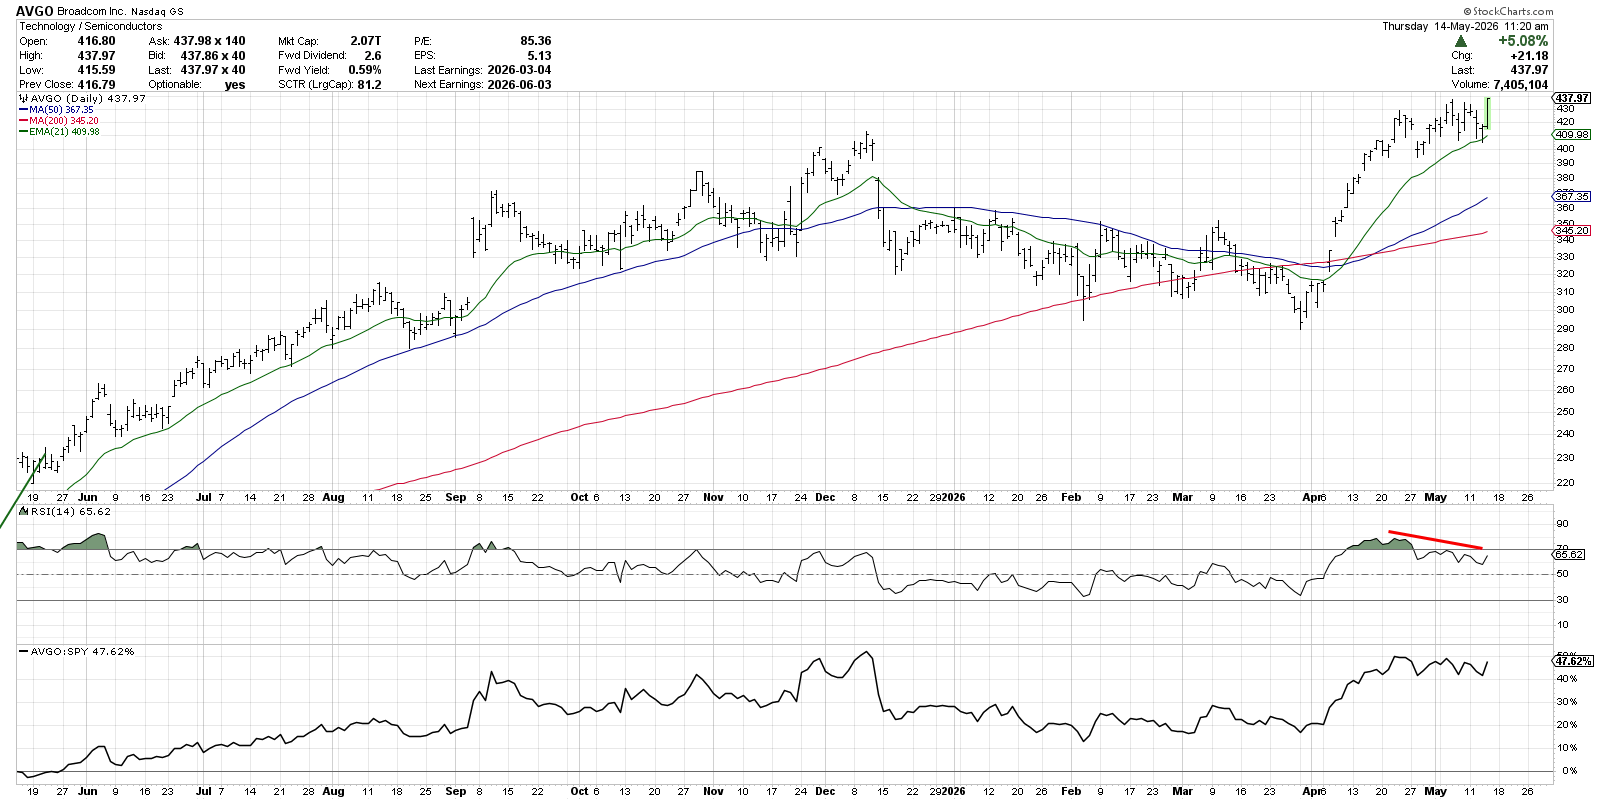
Traders should watch the 21‑day EMA closely. A break below it signals a likely pullback, while a bounce with strong RSI suggests the rally may continue.
Disclaimer: This material is for educational purposes only and does not constitute financial advice. Readers should consider their own financial situation and consult a qualified professional before making any investment decisions.
Source: Materials provided by https://articles.stockcharts.com.Note: Content may be edited for style and length.