

The MTUM ETF, which follows the momentum factor, just posted its longest eight‑day win over the S&P 500 since it started in 2013. The fund surged 6.2 % more than the index after geopolitical tension eased in early April.
Should you jump onto this momentum train now, or wait for the next stop? Oil prices are rising again after fresh U.S.–Iran tensions, but the real driver for MTUM right now is the strength of semiconductor stocks.
Semiconductor Power Boosts the Fund
Every May and November, MTUM refreshes its list of stocks, keeping those that are still climbing and dropping the laggards. Today, about 40 % of the fund is in technology, media and telecom companies.
The biggest holdings are chip makers: Broadcom, Micron, NVIDIA, Lam Research, and AMD. Last week the semiconductor sector jumped 11 %, giving MTUM a big tailwind.
What You Own Can Change Quickly
Peter Lynch says, “Know what you own, and why you own it.” MTUM is a strong, low‑turnover fund right now, but its composition will shift as the market changes.
Reading the MTUM vs. S&P 500 Chart
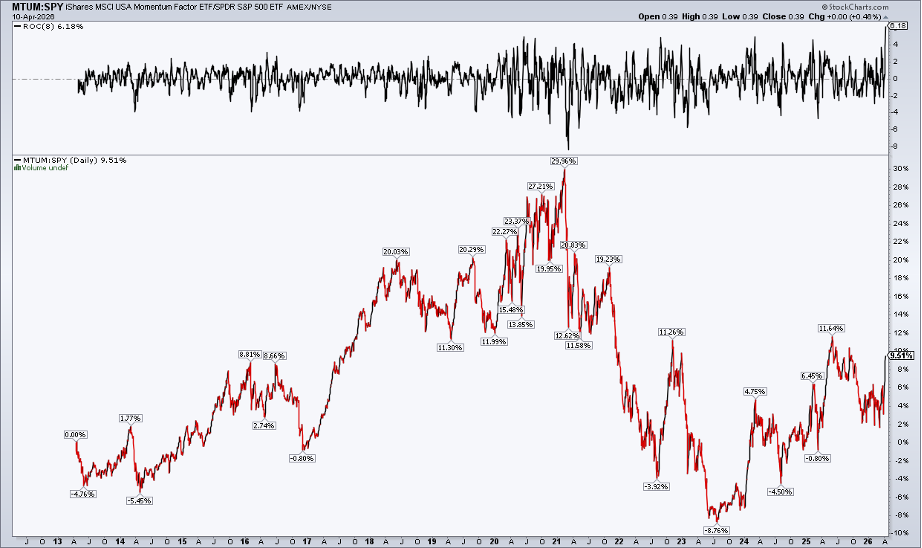
Looking at the MTUM/S&P 500 line over the past five years, two patterns appear.
- The recent win streak pushes the ratio close to its high range from late 2022 to early 2024. This matches a strong market lift from March to May 2025.
- Earlier, MTUM surged at the start of 2024, riding the AI‑driven rally that began in late 2022.
Beware the Backward‑Looking Nature of Momentum
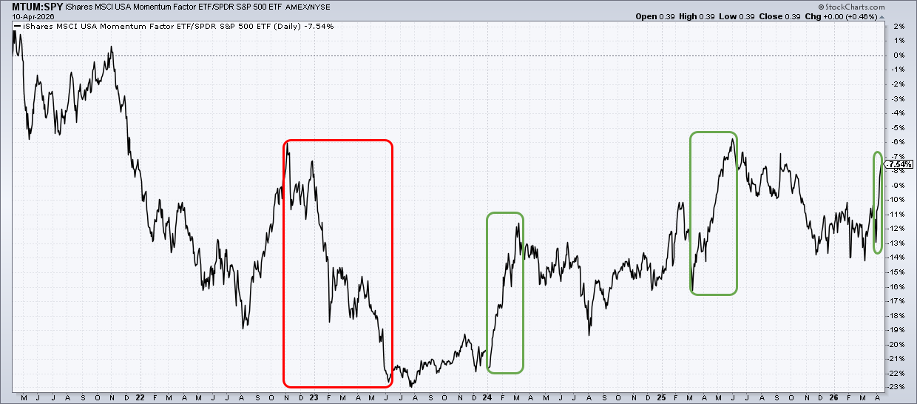
Momentum looks at past price moves. If a trend flips, the alpha can disappear fast. In 2022, the market fell just before MTUM rebalanced, moving the fund into safer stocks just as the S&P 500 turned upward.
Other Signals to Watch
Besides MTUM, traders can look at broader market gauges that compare mid‑cap and small‑cap performance against large caps. When the smaller groups start beating the big names, it often means a risk‑on environment.
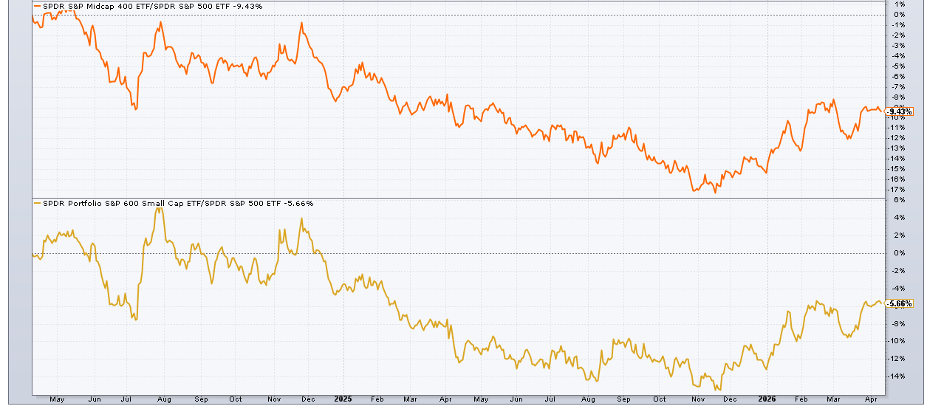
These charts showed the mid‑cap and small‑cap ratios bottoming last November and now climbing back toward recent highs.
Current Market Mood
Right now, the semiconductor trade is the main engine for MTUM. Even with tensions in the Middle East, oil price swings, and shifting interest rates, the overall bull market theme stays strong.
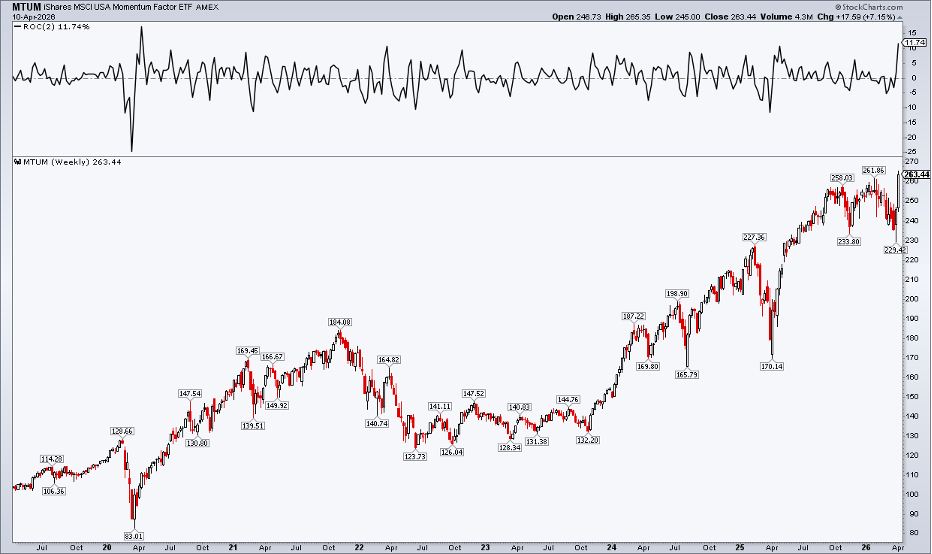
MTUM closed at a new all‑time high last Friday, up 11.7 % over the past two weeks – its best run since April 2020.
Bottom Line
Momentum has risen to the top of the S&P 500 factor list in March and early April. The ETF is at a record high with strong short‑term gains.
Use MTUM together with other technical clues to help steer through today’s volatility and market spread.
Disclaimer: This content is for educational purposes only and does not constitute financial advice. Always consider your own situation or consult a professional before acting.
Source: Materials provided by https://articles.stockcharts.com.Note: Content may be edited for style and length.