

This week the market saw big moves. Some stocks in the famous "Magnificent 7" jumped high, but the rise may be slowing. When a stock breaks out, we watch the daily chart for signs that the momentum could fade.
Below are three examples. Each stock broke out early in the week, then finished with a bearish candle pattern. The main trend still looks up, but the patterns hint at a possible short‑term pullback.
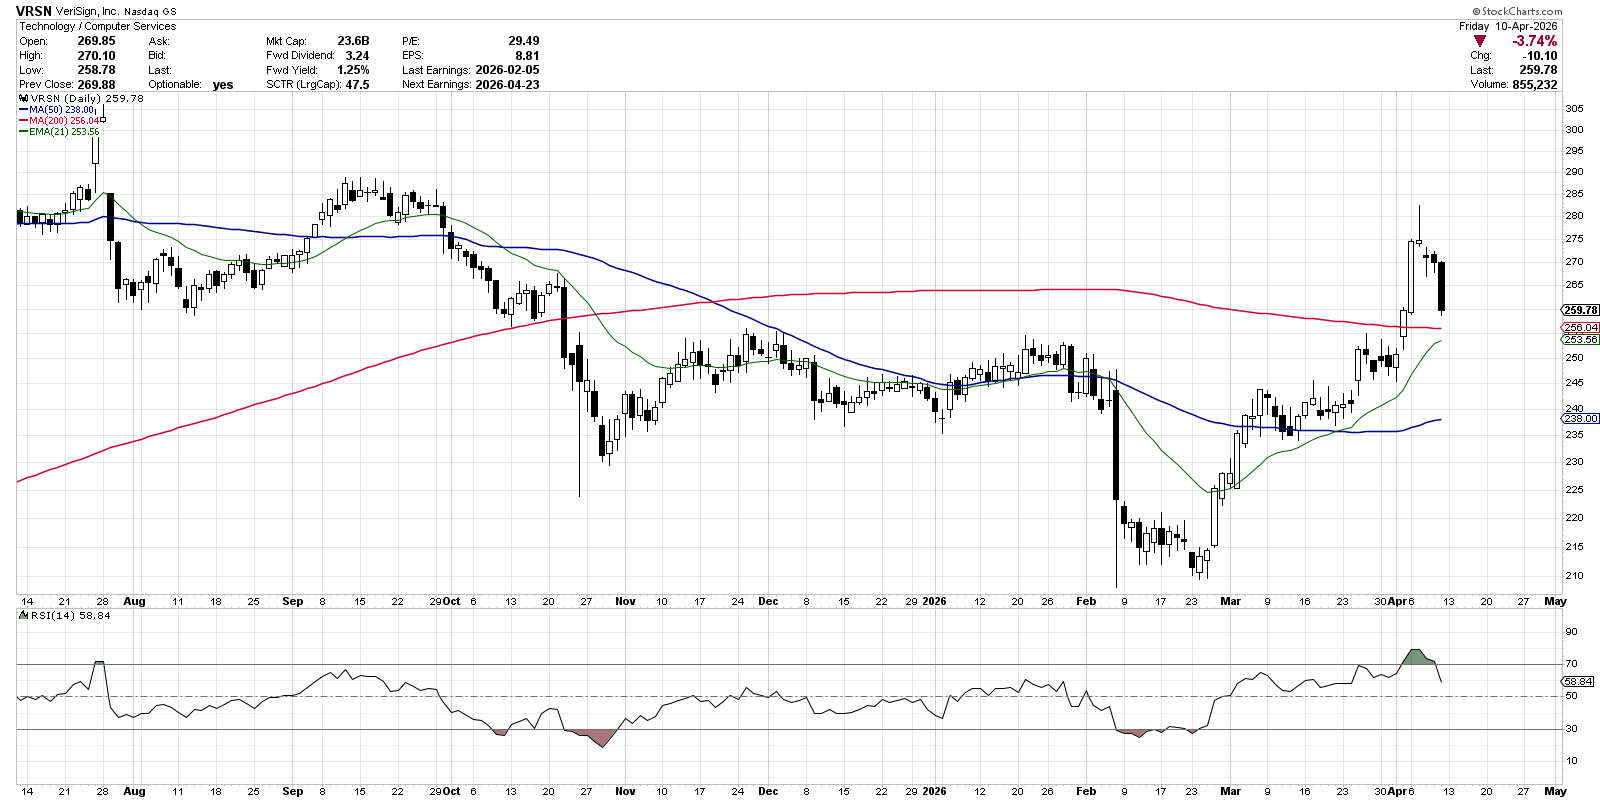
VeriSign (VRSN) – Shooting Star Pattern
VeriSign, a tech security company, rallied in March and rose from about $210 to $275. On Tuesday the price fell back near the day’s low, creating a classic shooting‑star candle. This candle has a long upper shadow and closes near the opening price, suggesting the rally may be losing steam.
The stock also had an RSI above 70 earlier in the week, showing it was overbought. Overbought conditions can turn into a quick drop, and the shooting‑star confirmed that risk.
After the candle, VeriSign fell another 5% by Friday. We are watching the 200‑day moving average for support. A break below that line could mean more downside.
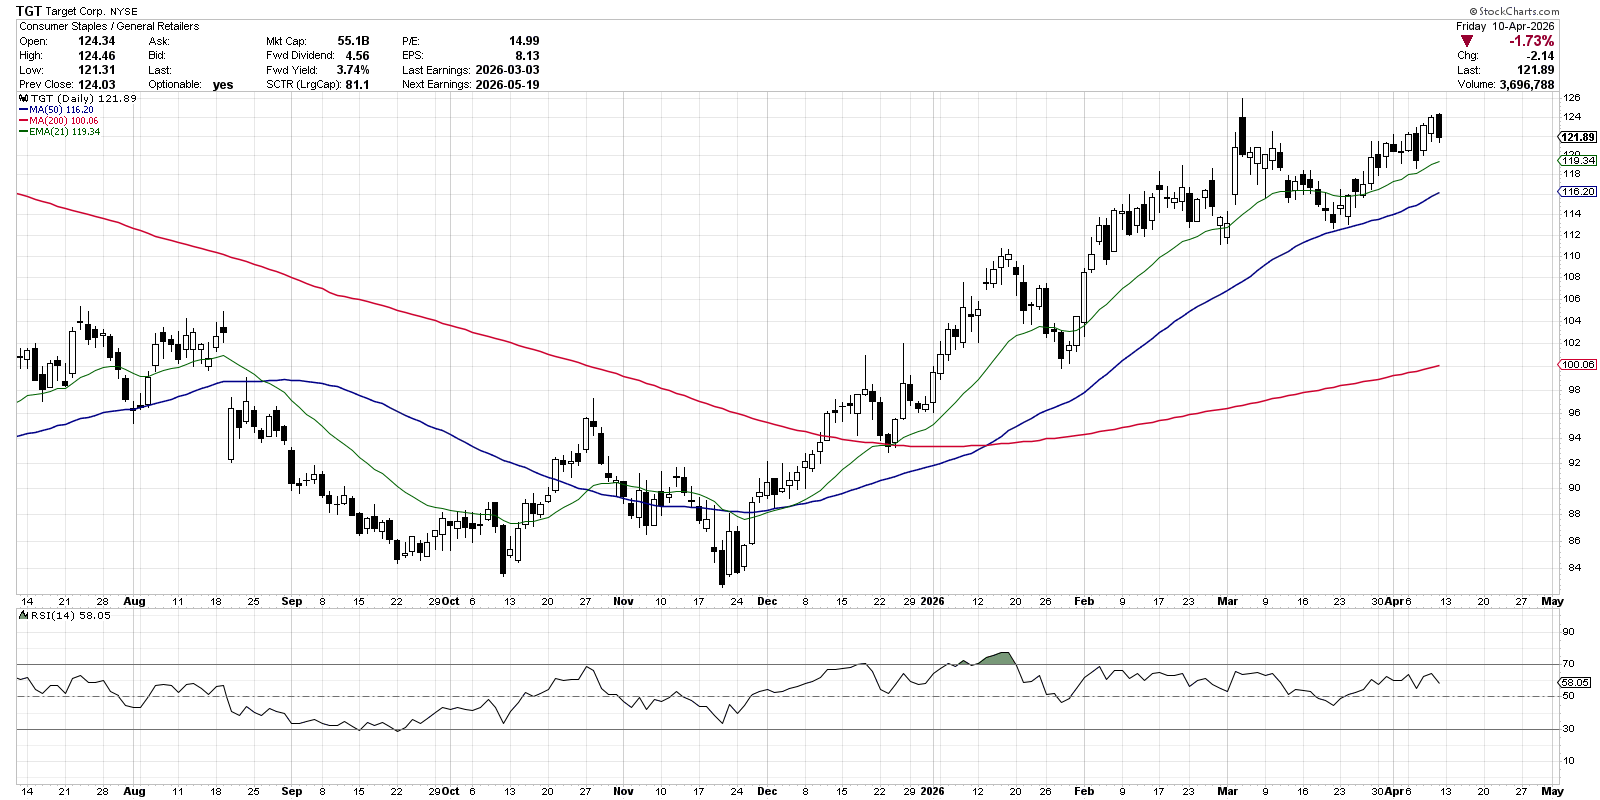
Target (TGT) – Bearish Engulfing Pattern
Target’s chart has been steady in April, testing a March high around $126. On Thursday the stock surged, but Friday closed lower, forming a bearish engulfing candle. This pattern shows strong buying on day one, then weaker buying on day two, pulling the price down.
Because the price is near its recent peak, the engulfing candle may start a short‑term pullback. We are keeping an eye on the 21‑day EMA and the 50‑day SMA for possible support.
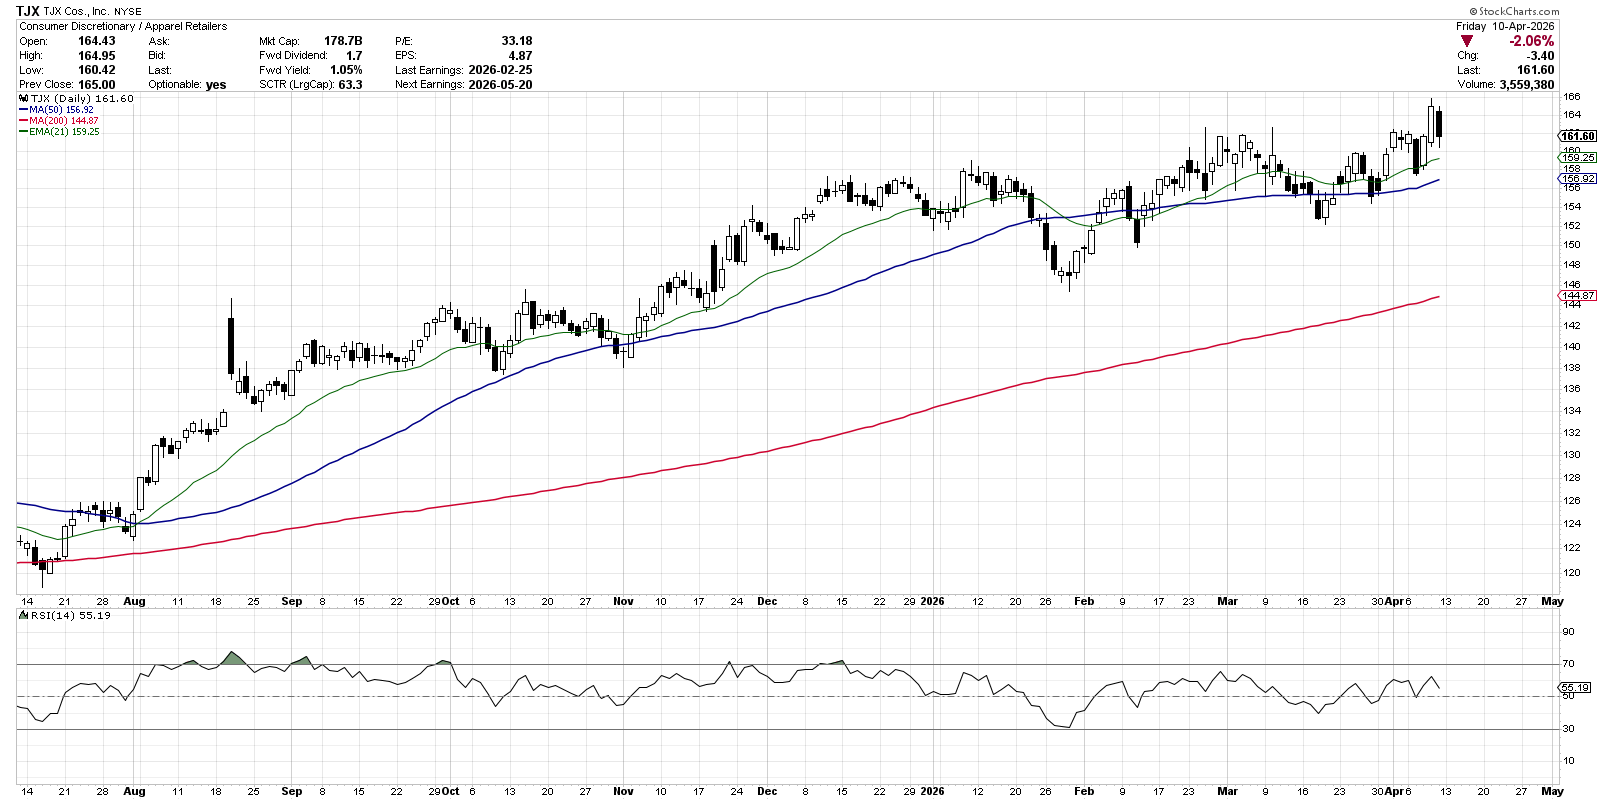
TJX Companies (TJX) – Bearish Harami Pattern
TJX, the parent of popular clothing stores, has been climbing along with other apparel stocks. Thursday set a new record above $162. On Friday the candle opened lower and closed near Thursday’s opening price, creating a bearish harami.
The harami, like the engulfing pattern, shows a shift from buying to selling over two days. As long as TJX stays above the breakout level of $162, the uptrend stays intact. A fall below the March low around $152 could start a new downtrend.
Disclaimer: This material is for educational purposes only and does not constitute financial advice. Always consider your personal financial situation or consult a professional before making investment decisions.
Source: Materials provided by https://articles.stockcharts.com.Note: Content may be edited for style and length.