

One headline can change everything. After the United States and Iran agreed to pause fighting for two weeks, and news of talks between Israel and Lebanon appeared, investors started looking at stocks again.
Now the S&P 500, Nasdaq Composite and Dow Jones Industrial Average are all trading above their 200‑day simple moving averages. In plain words, the big indexes are higher than the average price they had over the last 200 days.
All Major Indexes Are Above Key Averages
If you sort U.S. indexes by their distance from the 200‑day average, you’ll see every major index sitting on top of that line. The same is true for the 50‑day and 20‑day exponential moving averages.
Looking worldwide, the iShares MSCI South Korea Capped ETF (EWY) is the strongest performer among country funds.
Volatility Is Cooling Down
The fear gauge, known as the VIX, kept falling and closed below 20 for the first time since late February. Lower volatility usually means investors feel calmer.
Oil‑price volatility, measured by the OVX, also dropped, though it stays relatively high.
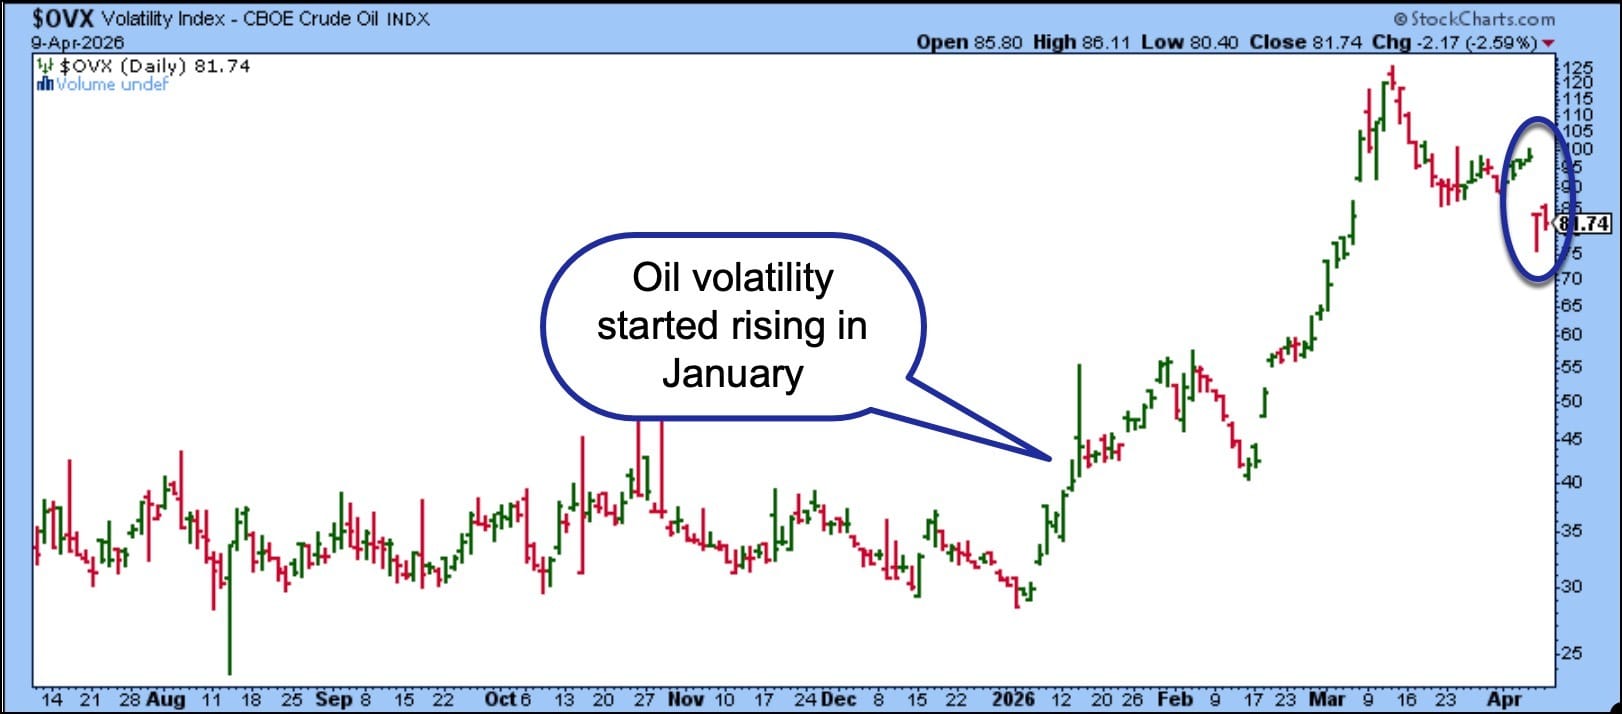
After a sharp dip on Wednesday, the OVX moved up a bit on Thursday, then fell again after news of possible talks between Israel and Lebanon. It closed at 81.74 – far below its March high.
Crude oil itself slipped a little, with light crude trading around $98.70 a barrel. Prices could keep falling if ship traffic through the Strait of Hormuz returns to normal.
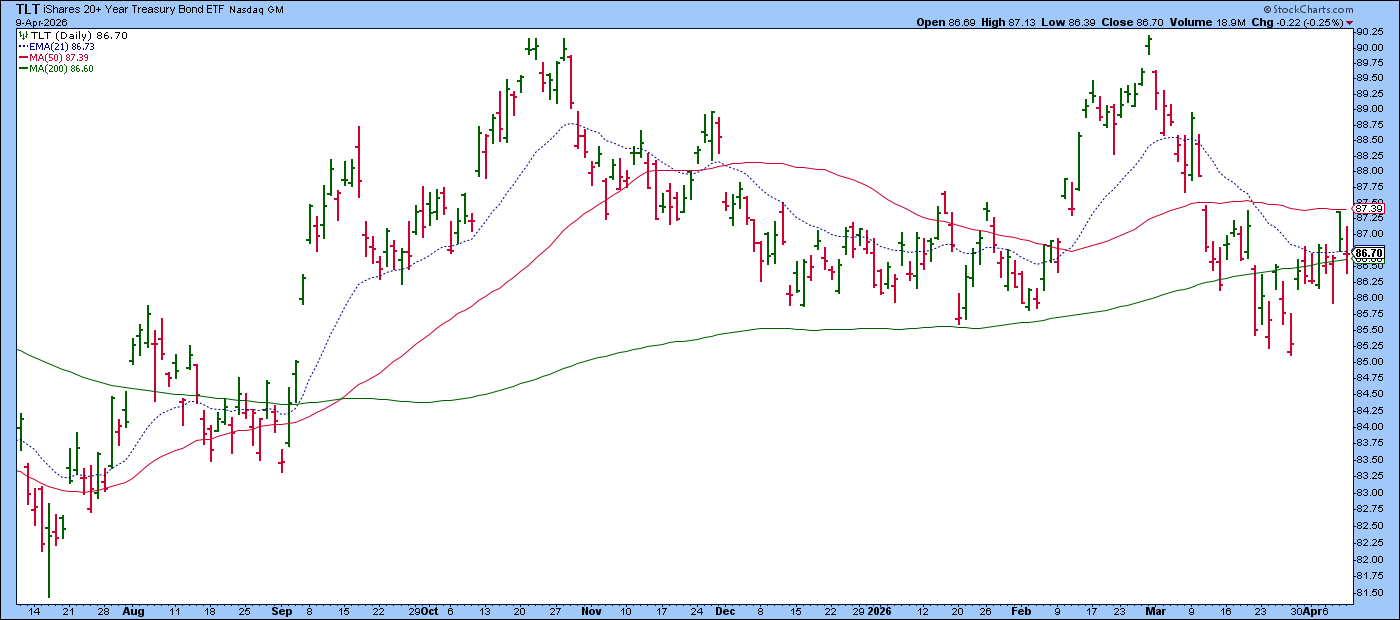
Bond Moves Mirror the Market
When stocks jumped, the 20‑plus‑year Treasury ETF (TLT) hit resistance at its 50‑day average but found support near the 21‑day EMA. By Thursday, TLT closed just under that short‑term support line.
Inflation Still a Concern
Higher oil prices keep inflation worries alive, making it harder for the Federal Reserve to cut rates this year. The latest personal consumption expenditures (PCE) numbers matched forecasts, but core and headline rates are still above the Fed’s 2 % goal.
If the upcoming CPI report also lands near expectations, bonds may stay in their current range. A hotter‑than‑expected reading could push stocks down and revive talk of higher rates.
Current market data shows about a 31 % chance of a rate cut at the December 2026 meeting, meaning most experts think rates will stay steady for now.
Gold’s Reaction to Rate Outlook
Because a cut seems unlikely, gold has struggled to gain momentum. On a five‑year weekly chart, the price bounced off the 38.2 % Fibonacci level that also lines up with the 40‑week moving average.
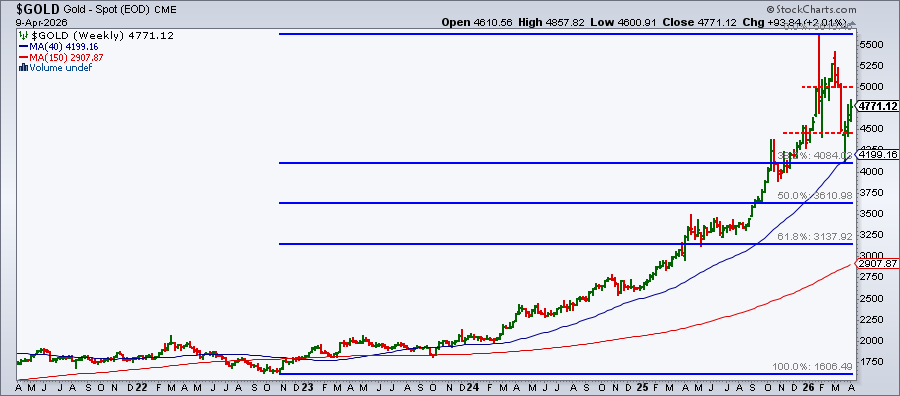
If gold climbs higher, the next hurdle is near $5,000. A break below $4,550 could send it back toward the 38.2 % Fibonacci zone.
What to Watch This Week
Investors should keep an eye on two big items: upcoming inflation data and oil‑price movements. Both can sway stocks, bonds and gold. While equities have recovered from March’s losses, the muted response in gold and the cautious bond market suggest the rally may still be fragile.
Disclaimer: This content is for educational purposes only and does not constitute financial advice.
Source: Materials provided by https://articles.stockcharts.com.Note: Content may be edited for style and length.