


S&P 500 futures opened a little lower on Sunday night after fresh tension in the Middle East. The news caused a short dip, but the market recovered quickly the next morning. A short pause in the rally makes sense right now.
A Historic Rally
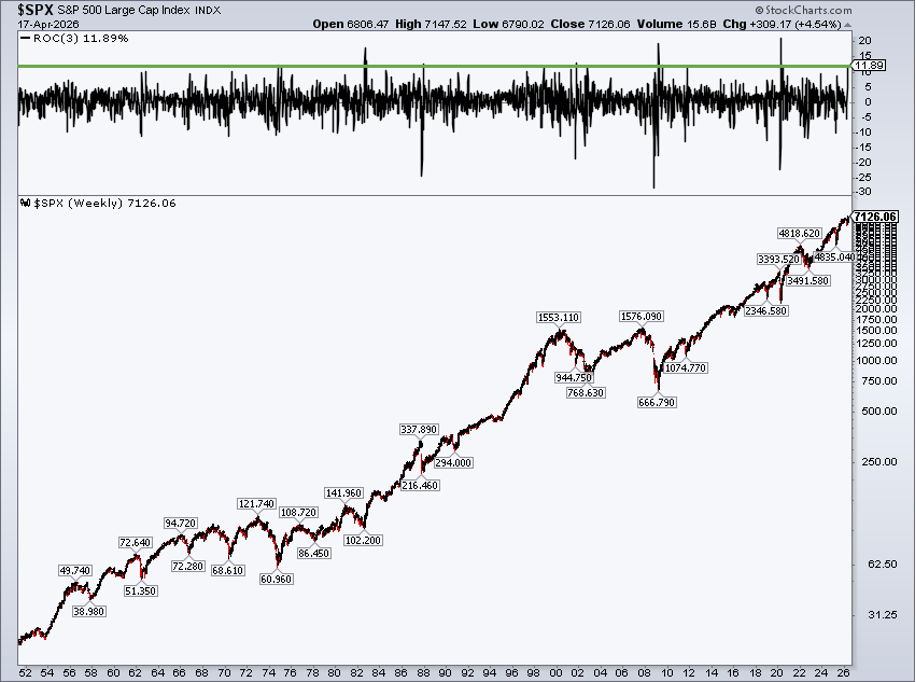
The index has climbed about 12% in just three weeks. That move ranks as the 11th best rally since 1950 when we look at the Rate‑of‑Change indicator on a weekly chart. Analysts say the April rally could become the third‑best April on record.
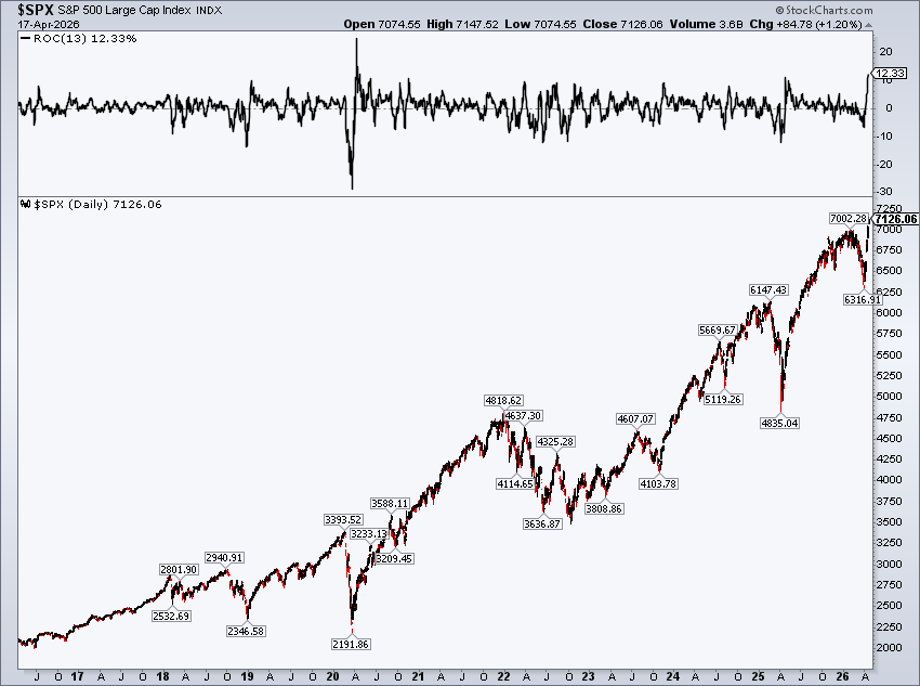
In just 13 trading days the index rose 12.3%, its fastest stretch since the COVID crash of April 2020.
Is the Market Overbought?
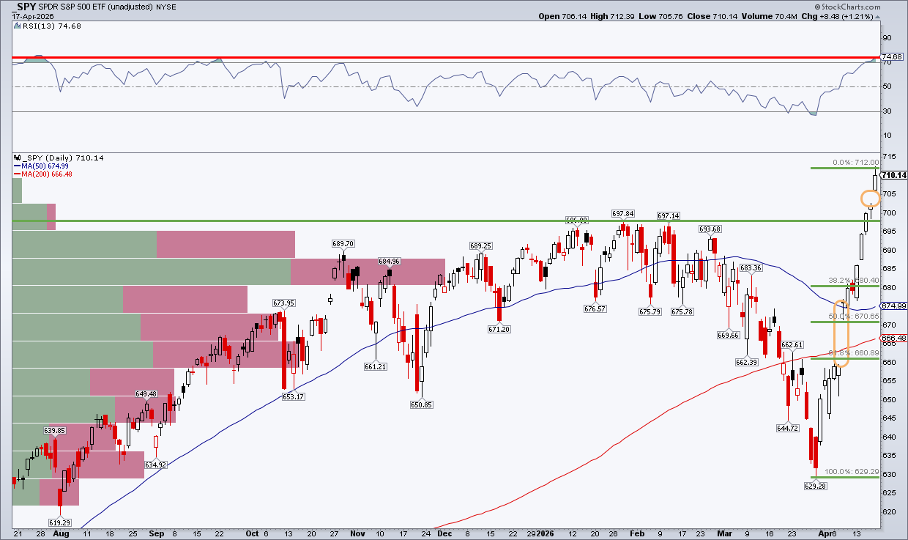
Even though the index is above the 70 level on the RSI, it only fell about 9% before jumping higher again. That is a milder correction than most markets see. The RSI was adjusted to a 13‑day period to show that the S&P 500 is the most overbought since last July.
The Gap on the SPY Chart
Look at the daily chart of the SPDR S&P 500 ETF (SPY). On April 8 the price opened above $676 after closing below $660 the day before. Traders call this a “gap‑up.” Some schools of thought say every gap must be filled, but that rule is more myth than fact.
Earnings Season Adds Drama
This week is the heart of the first‑quarter earnings season. Big‑name companies will report how they are handling geopolitics, tariffs, and inflation. Price moves after earnings matter more than the headline numbers.
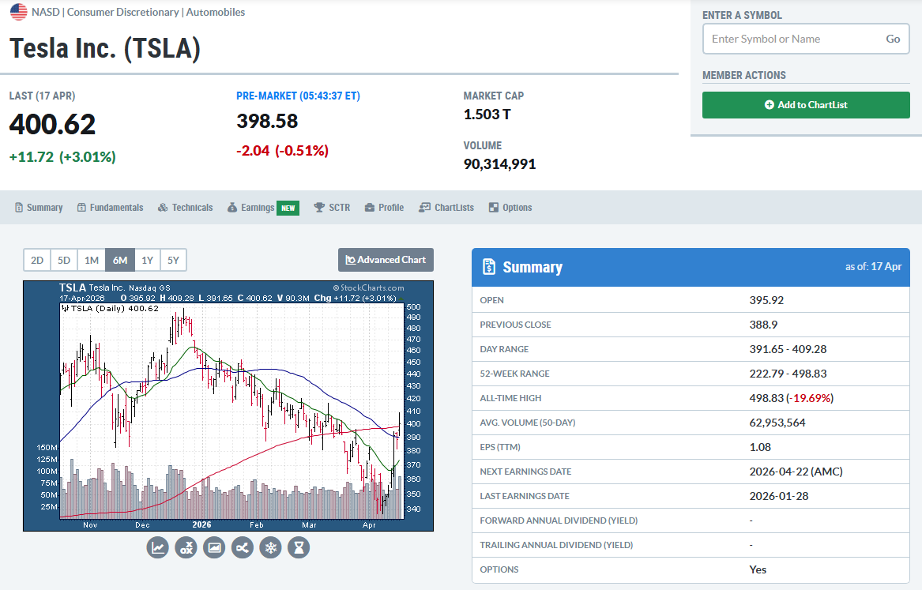
For example, Tesla will report on April 22. Its shares are already 19% above last month’s low and sit near the 200‑day moving average.
The V‑Bottom Still Holds
The SPY chart showed a clear V‑bottom in early April. That pattern turned the market risk‑on for the rest of the month. The previous resistance around $697‑$698 is now acting as support.
On the weekly chart three white‑soldier candles point upward, suggesting the uptrend may keep going.
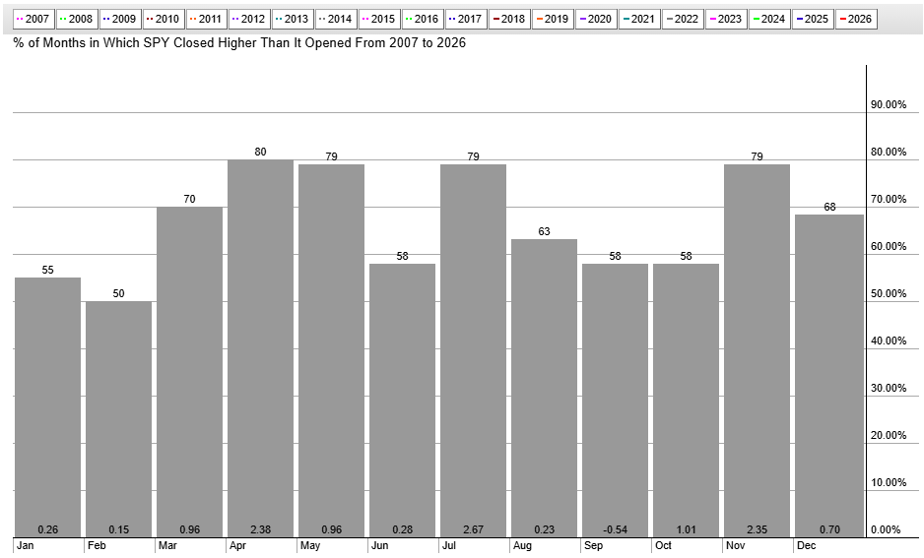
Historically, April through July have been the strongest months for the market, with win rates near 80% over the last 20 years.
Sector Rotation Drives Breadth
Broad market breadth looks solid when you include all sectors. Technology and Real Estate ETFs are at 52‑week highs, a big change from their weakness earlier this year.
Small‑cap, mid‑cap, and international ETFs also hit record weekly levels last Friday.
Bottom Line
Traders should watch the remaining gap, key Fibonacci levels, and upcoming earnings reports. The overall trend stays bullish, but a break below the V‑bottom could flip the market.
Disclaimer: This article is for educational purposes only and does not constitute financial advice.
Source: Materials provided by https://articles.stockcharts.com.Note: Content may be edited for style and length.