

The S&P 500 recently rose above 7,000. This shows fresh optimism after a sharp fall in March. Investors wonder if this new rise will last.
The Past: A Gap Above a Key Level
In early April, a brief pause in U.S.–Iran tensions sparked a jump past 6,750. That move filled an upside gap and pushed the index over an important Fibonacci level.
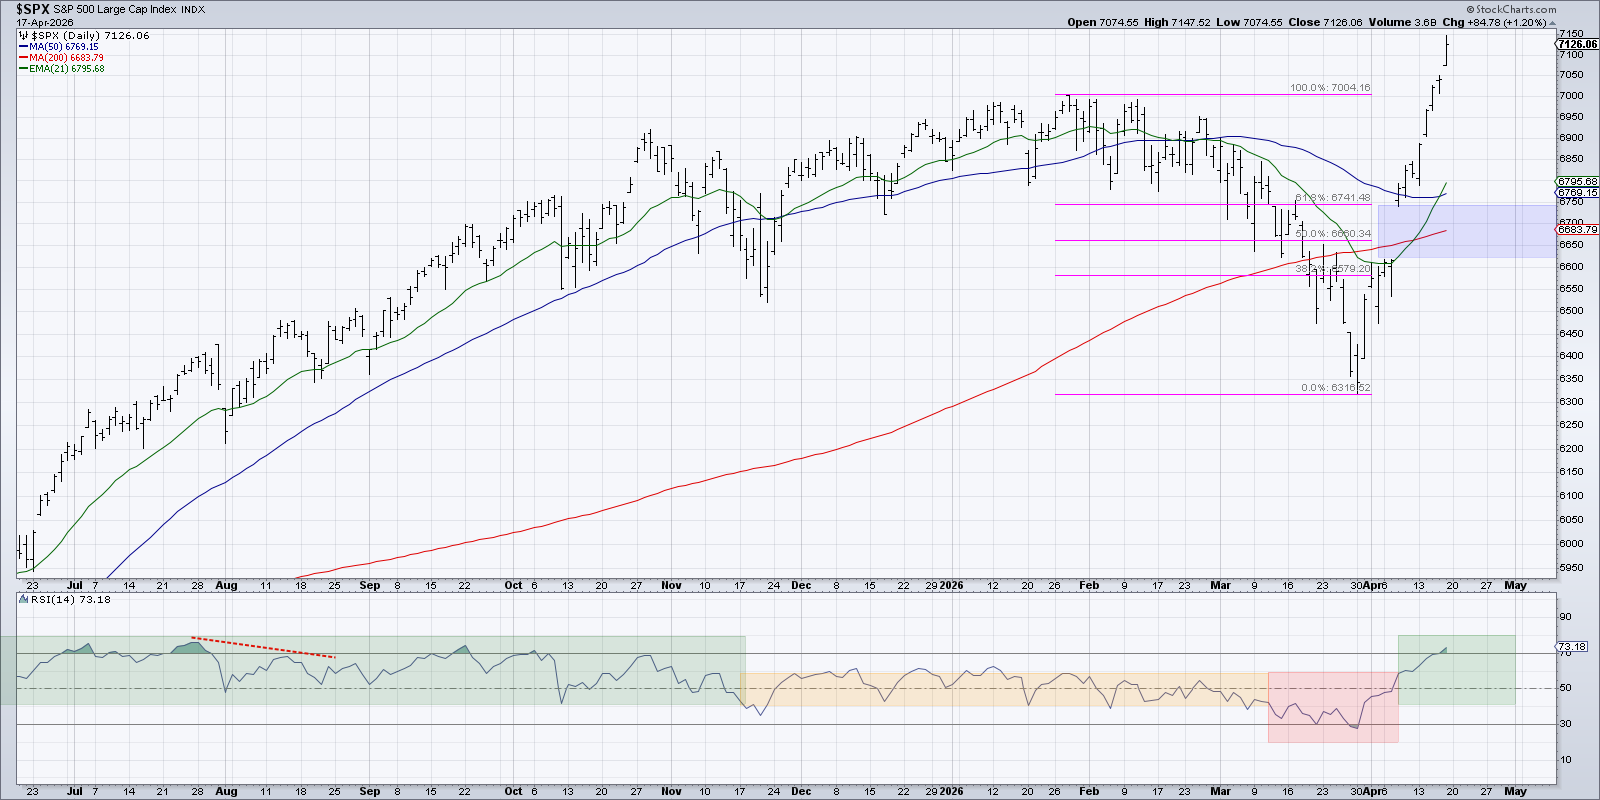
The Fibonacci line, based on the January high and March low, sits near 6,741. The 200‑day moving average and this line acted as strong resistance. After the gap, large‑cap growth stocks kept pushing higher, and the RSI moved above 60, hinting at renewed buying interest.
The Present: A Strong Breakout
This week’s move broke past the old record and turned the medium‑term outlook bullish. That suggests the rally could be part of a larger uptrend for risk assets.
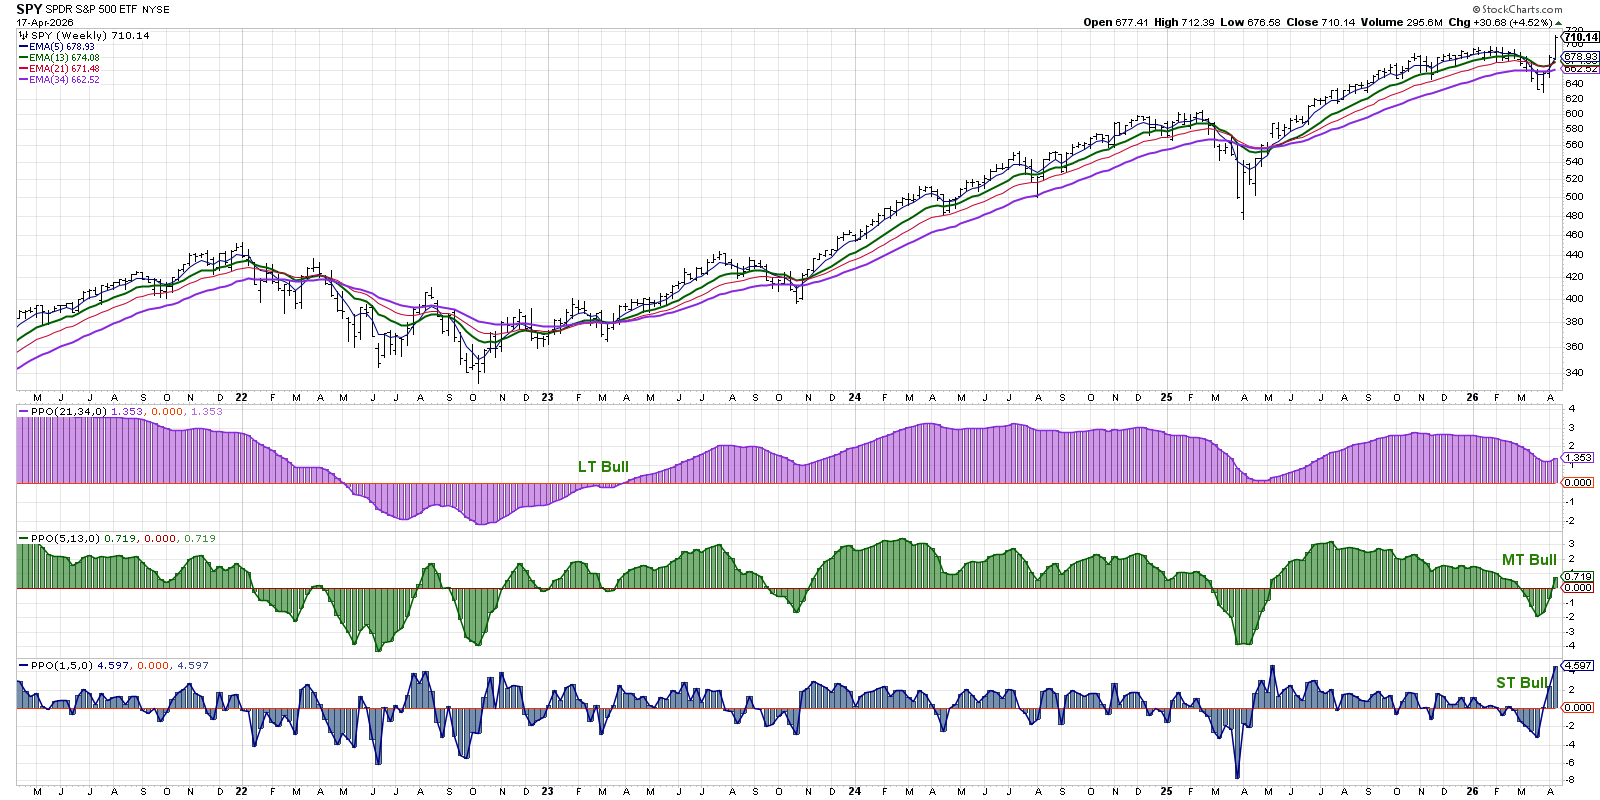
Our Market Trend Model looks at weekly S&P 500 data on three time frames. The medium‑term signal turned negative in February after the Middle‑East events, urging investors to protect capital. Two weeks ago the short‑term signal went positive, and this week’s strong rise flipped the medium‑term signal back to positive, echoing past bullish periods in May 2025 and November 2024.
The Future: Will Breadth Confirm?
To know if the breakout will hold, we check market breadth. Do enough stocks join the rally? Broad participation signals strong investor confidence.
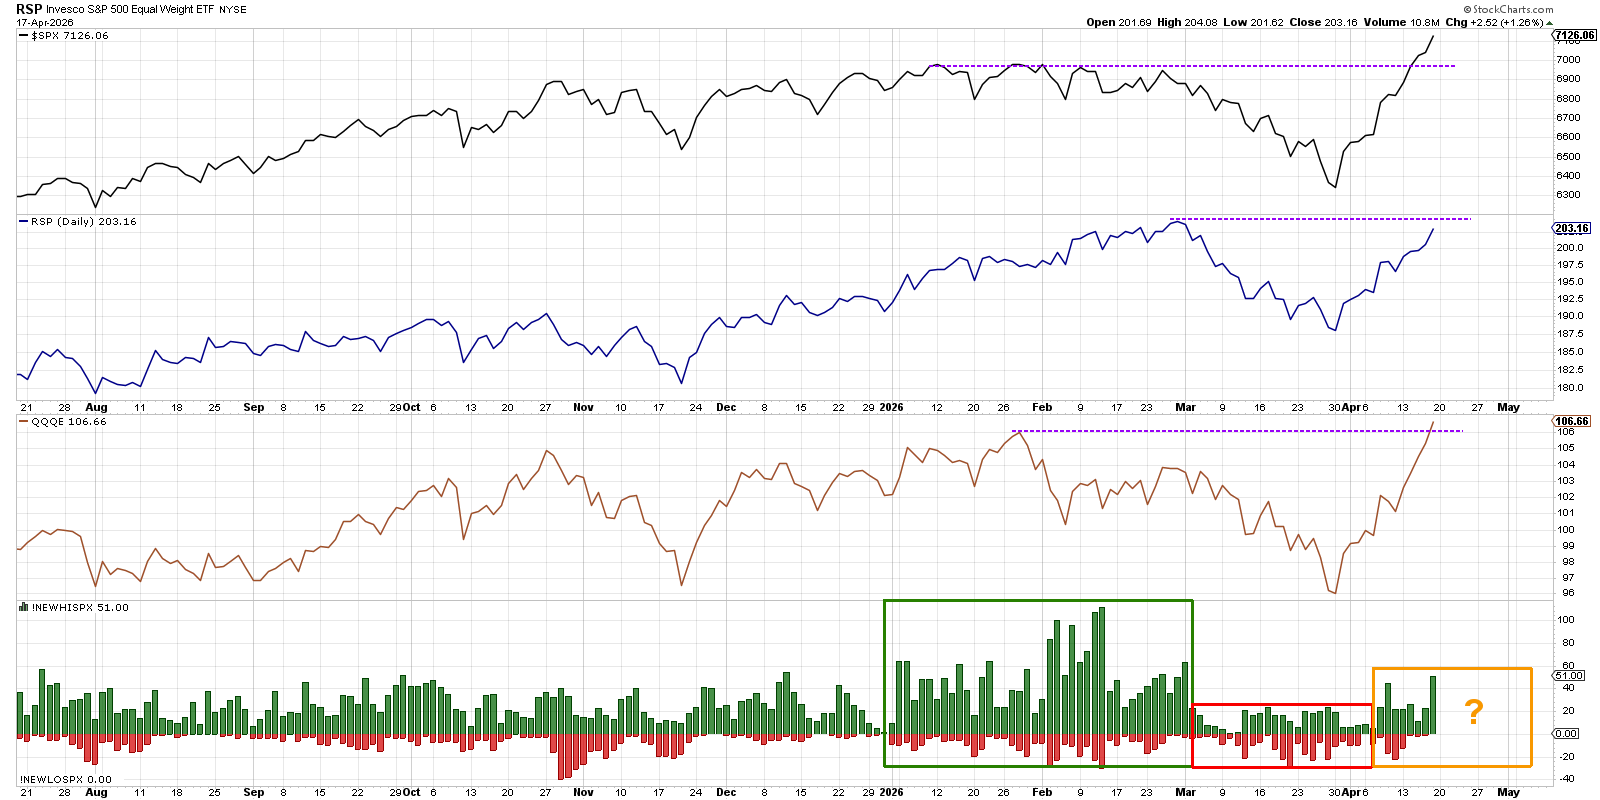
The top panel shows the regular S&P 500, the equal‑weighted S&P 500, and the equal‑weighted Nasdaq 100. Equal‑weighted indexes remove the bias toward mega‑cap stocks, giving a clearer view of overall market health.
The S&P 500 made a new close earlier in the week, but the equal‑weighted Nasdaq only confirmed its breakout on Friday. Next week we will watch the equal‑weighted S&P 500 to see if it follows suit, which would strengthen the bullish case.
In the bottom panel we track how many S&P 500 stocks hit new 52‑week highs. After a quiet March, April shows more stocks reaching fresh highs—about 10 % did so on Friday.
This breakout above 7,000 continues the upside gap from early April. The Market Trend Model supports the move, matching signals from earlier bullish phases. The next step is to see if breadth indicators stay strong, giving us confidence that the market can keep rising through the second quarter.
Source: Materials provided by https://articles.stockcharts.com.Note: Content may be edited for style and length.