


Stocks are higher this month. The S&P 500 has bounced after two monthly drops. The pattern looks a bit like last year, but the reasons are different.
What does this mean for you as we move into the second quarter?
Bearish Shape Still Hidden
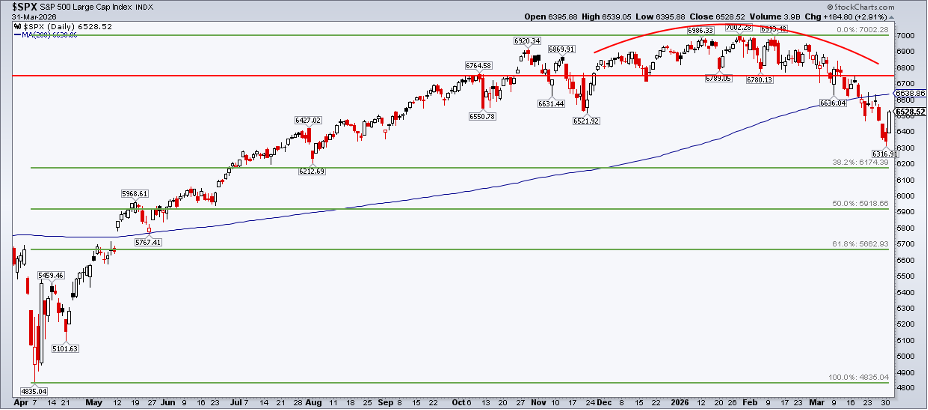
Looking deeper, other markets can hint where stocks might go. The S&P 500 still shows a rounded‑top shape that suggests a possible drop. The bears have taken the main trend after the index fell below 6,780.
The 38.2 % Fibonacci level from the April 2025 to January 2026 rise sits near 6,174. The 200‑day moving average is close to the recent close, but the VIX stays in the mid‑20s, so things can change fast.
Do Bonds Hold the Key?
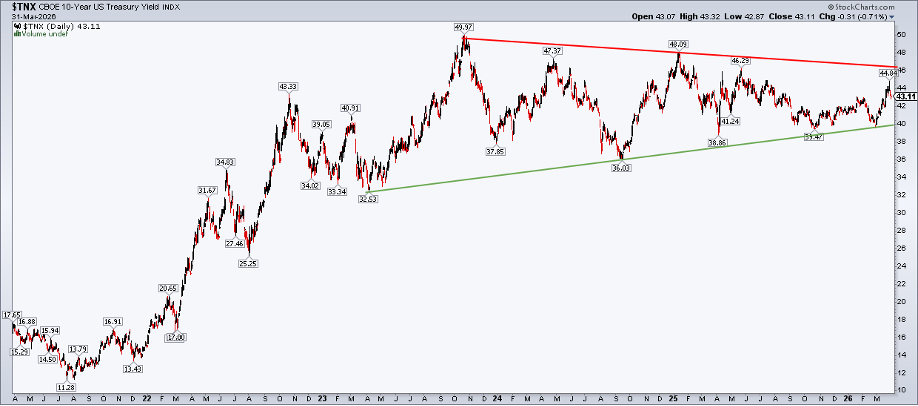
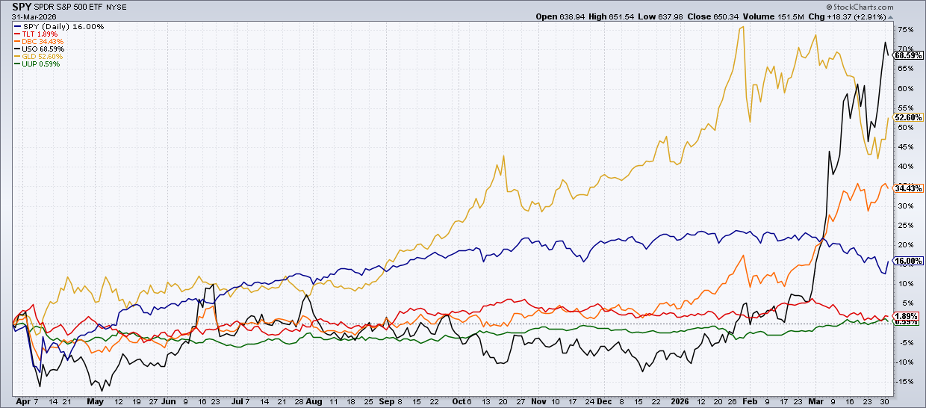
Fixed‑income markets are the usual starting point for intermarket checks. The 10‑year Treasury yield is in a tight triangle. Support sits just under 4 %, while resistance is a little above 4.6 %.
Yield fell from 4.484 % last week to below 4.3 % as oil prices rose to $100. The 50‑day and 200‑day averages cross near 4.2 %, giving no clear signal.
Commodities Stay Steady as Oil Fluctuates
Oil slipped under $100 a barrel at the start of Q2, but gasoline prices rose to $4.06 per gallon.
Higher gasoline costs could slow shoppers’ spending. So far, consumer confidence and retail sales are holding up.
DBC Shows a Calm Pause
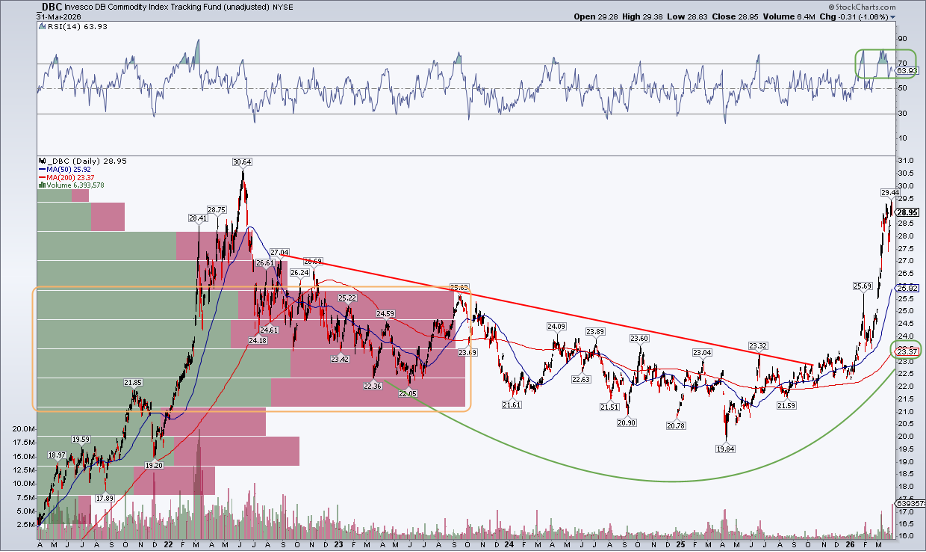
The Invesco DB Commodity Index Fund (DBC) is near its highest level since mid‑2022. The chart shows a short pause after a recent rise.
Both the 50‑day and 200‑day averages are climbing, and the RSI sits between 50 and 90, indicating bullish momentum.
Energy Prices Remain a Wild Card
Energy moves drive the DBC fund. The key level to watch is $27.50, the low in late March.
If price drops below that, a gap fill near $25 could happen. Support sits near $23, and strong volume around $26 may provide buying pressure if the market pulls back.
Dollar Shows a False Breakout
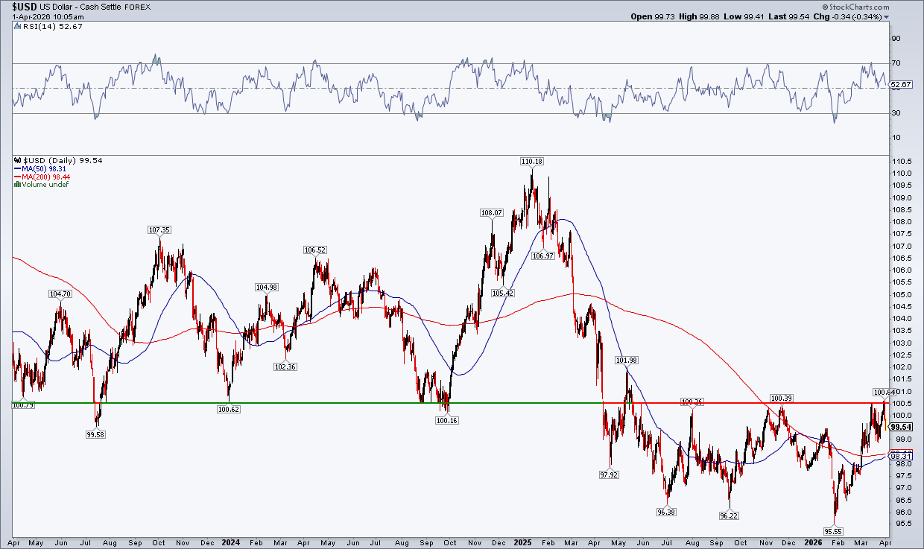
The U.S. Dollar Index briefly moved above 100.5 at the end of March, then fell as investors awaited employment data.
Short‑term and long‑term averages are both upward, suggesting bulls still lead. The RSI looks healthy, and the dollar is back in its usual range. Expect choppy moves.
Watch the Whole Intermarket Picture
All the major indexes and ratios can be seen on a market summary screen. Look for RRG charts, CandleGlance views, and technical scans of asset‑class ETFs.
Bottom Line
Stocks and bonds rallied at the end of March, while commodities cooled and the dollar slipped from resistance. Oil was the only strong performer, but that likely won’t last. Keep an eye on intermarket links to spot new patterns as equities stay in a long‑term uptrend.
Disclaimer: This article is for educational purposes only and does not constitute financial advice.
Source: Materials provided by https://articles.stockcharts.com.Note: Content may be edited for style and length.