

During the week the market moved up after a weak start. The Nifty index swung in an 845‑point range and closed near the top of that range. Overall feeling got better as worries eased and world markets gave a boost. The India VIX fell about 9% to 17.20, and Nifty ended up 302.95 points, a gain of 1.26%.
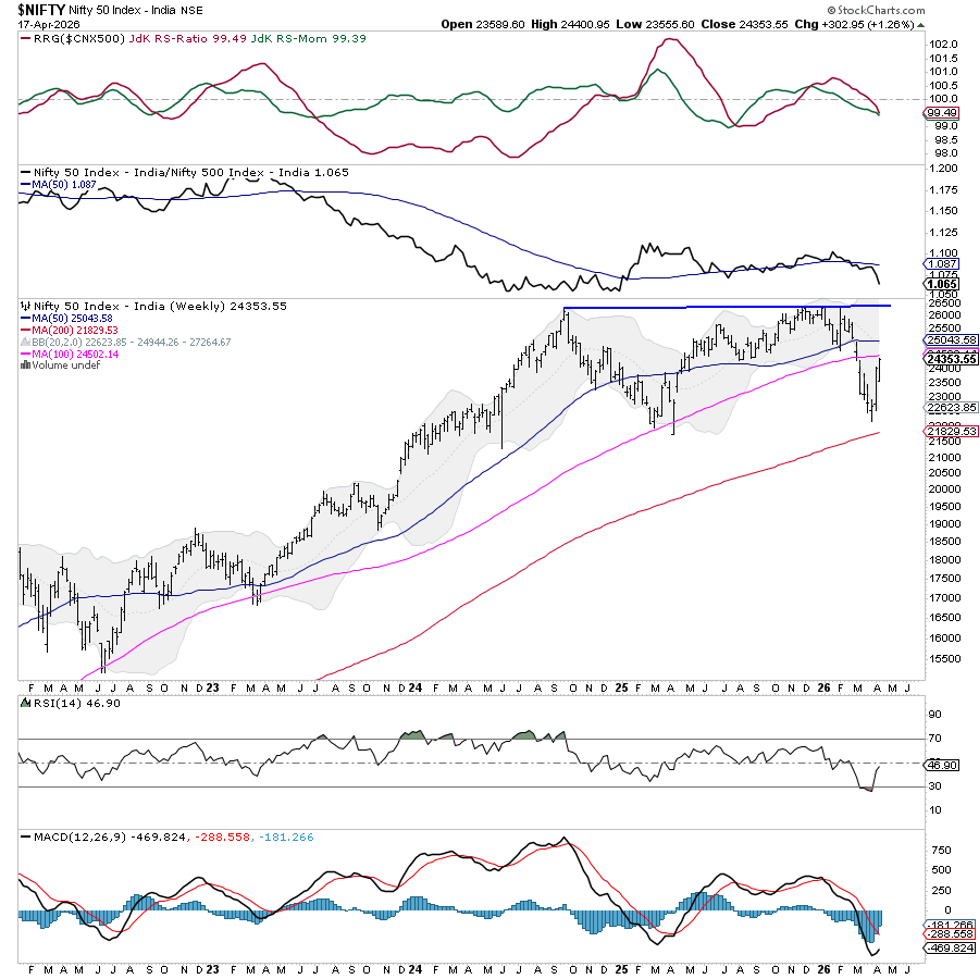
The bigger picture still looks like a sideways market. Nifty rose from lower levels but meets strong resistance between 24,500 and 24,700, which lines up with moving averages and past supply zones. If the index can close above this area, the up move may continue. If not, the market could stay in a tight range. Positive news like the reopening of the Strait of Hormuz could help, but staying above the resistance is key.
Next week may start with a lift. Immediate resistance sits at 24,500 and 24,700. Support levels are around 24,100 and 23,850.
The weekly RSI is 46.9, showing a neutral stance with no clear divergence. The MACD is still below its signal line, indicating weak bullish momentum. A bullish candle formed, suggesting the rebound could keep going.
From a pattern view, Nifty has shown a second‑week technical bounce. It trades below the 50‑week moving average (~25,043) and near the 100‑week average (~24,503). Not reclaiming these levels keeps the longer trend under pressure.
Because of this setup, a careful, stock‑specific plan is wise. The rebound might last a bit, but the strong resistance means big long bets are risky. Protect gains, avoid chasing the rally, and pick stocks that show real strength. Using clear price levels will help manage risk.
Sector Outlook for the Week
Using Relative Rotation Graphs (RRG), we compared each sector to the Nifty 500 index, which covers most of the market’s value.
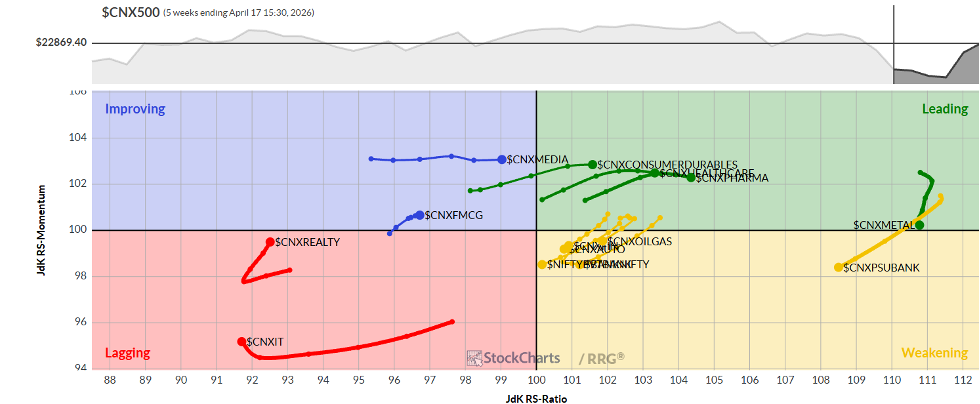
The RRG shows Mid‑cap, Energy, Pharma, Metal, Power & Infrastructure sectors in the leading quadrant. Power and Metal are losing some momentum, but the group may still beat the broader market.
Banking, PSU Bank, Auto and Financial Services sit in the weakening quadrant, meaning they lag behind the market.
IT and Services stay in the lagging quadrant, while Realty is improving its relative strength. Media and FMCG are in the improving quadrant.
Remember, RRG charts show relative strength and momentum. They are for analysis only and should not be taken as direct buy or sell signals.
Source: Materials provided by https://articles.stockcharts.com.Note: Content may be edited for style and length.