

Gold has gone up a lot in the last few years, but no move lasts forever. The price now looks a bit tired, so it’s a good time to ask if a big down‑trend could be starting. Before we look at charts, let’s remember where gold sits in the larger commodity cycle.
Usually, gold moves first, then copper, then oil. Gold reacts to future inflation, so it often leads the whole group. Copper follows when factories start buying metal for new projects. Oil is the last to turn because it depends on transportation and consumer demand, which change later.
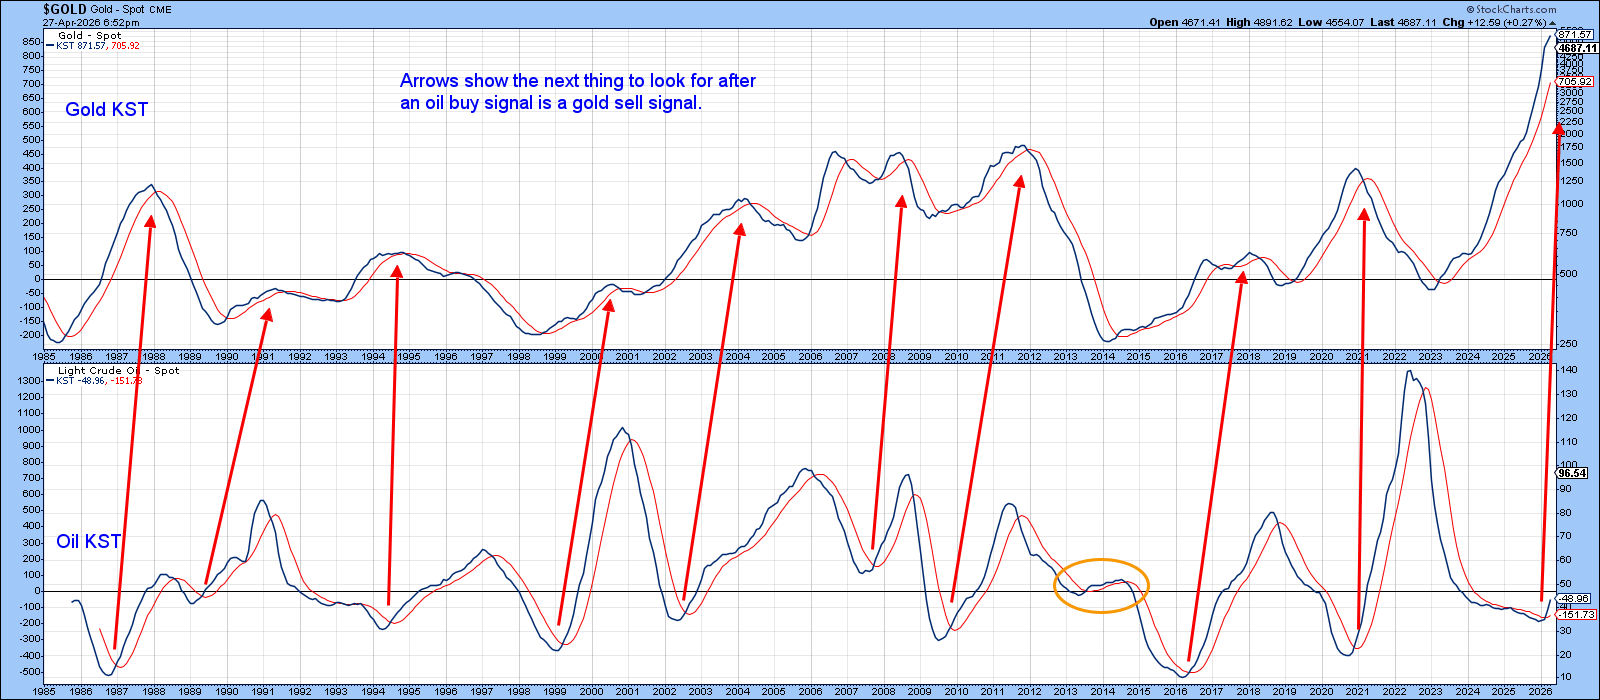
Chart 1 shows the long‑term momentum for gold and oil. The arrows point to the usual pattern: after oil momentum hits a low, gold often tops out soon after. Oil has just finished its low, so it makes sense that gold’s momentum could be peaking any time now.
Two Signs That Show a Bubble‑Like Situation
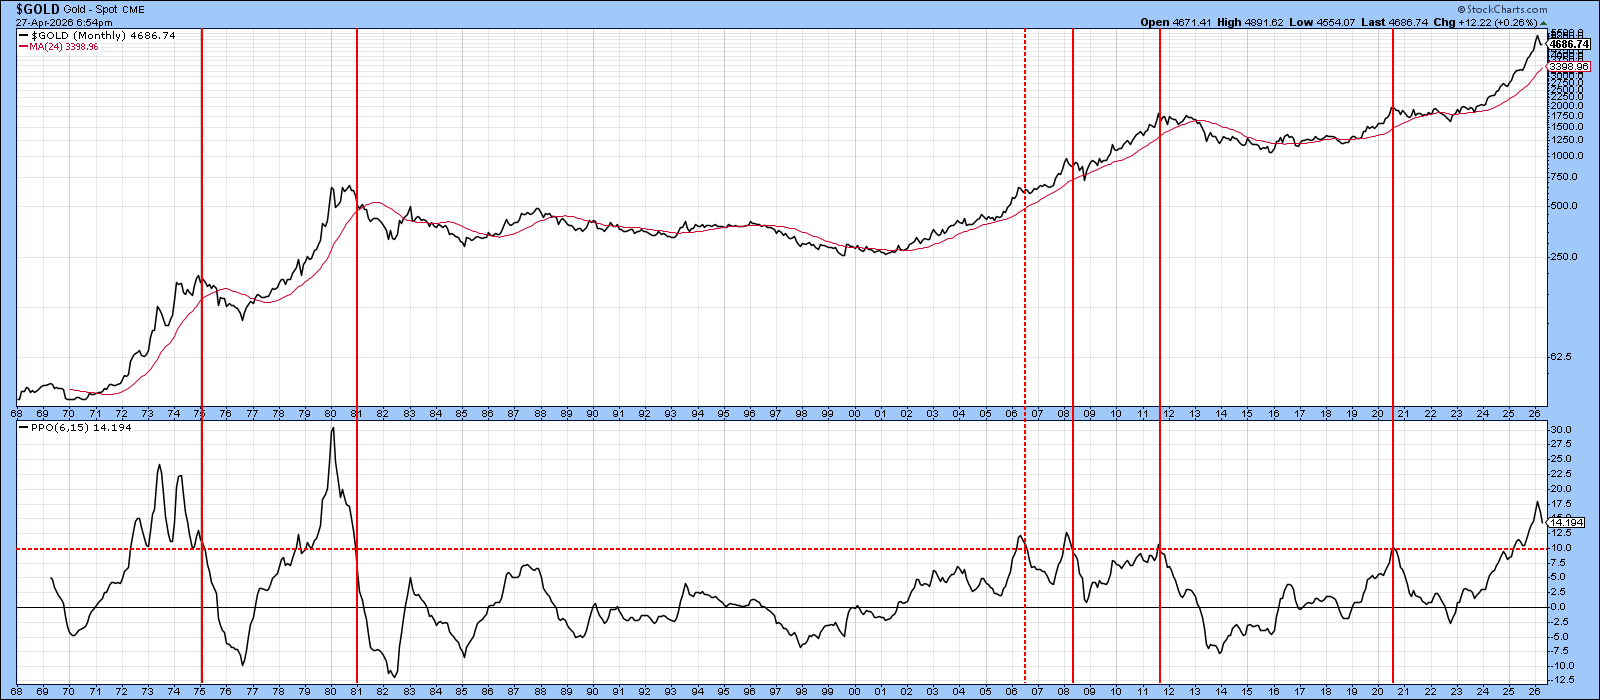
Chart 2 uses a monthly Percentage Price Oscillator (PPO) with 6‑ and 15‑month settings. A sell signal happens when the line goes above the overbought zone and then falls back below it. The PPO is already turning down sharply, but it hasn’t fully crossed back yet. A strong new price surge would be needed to stop this drop.
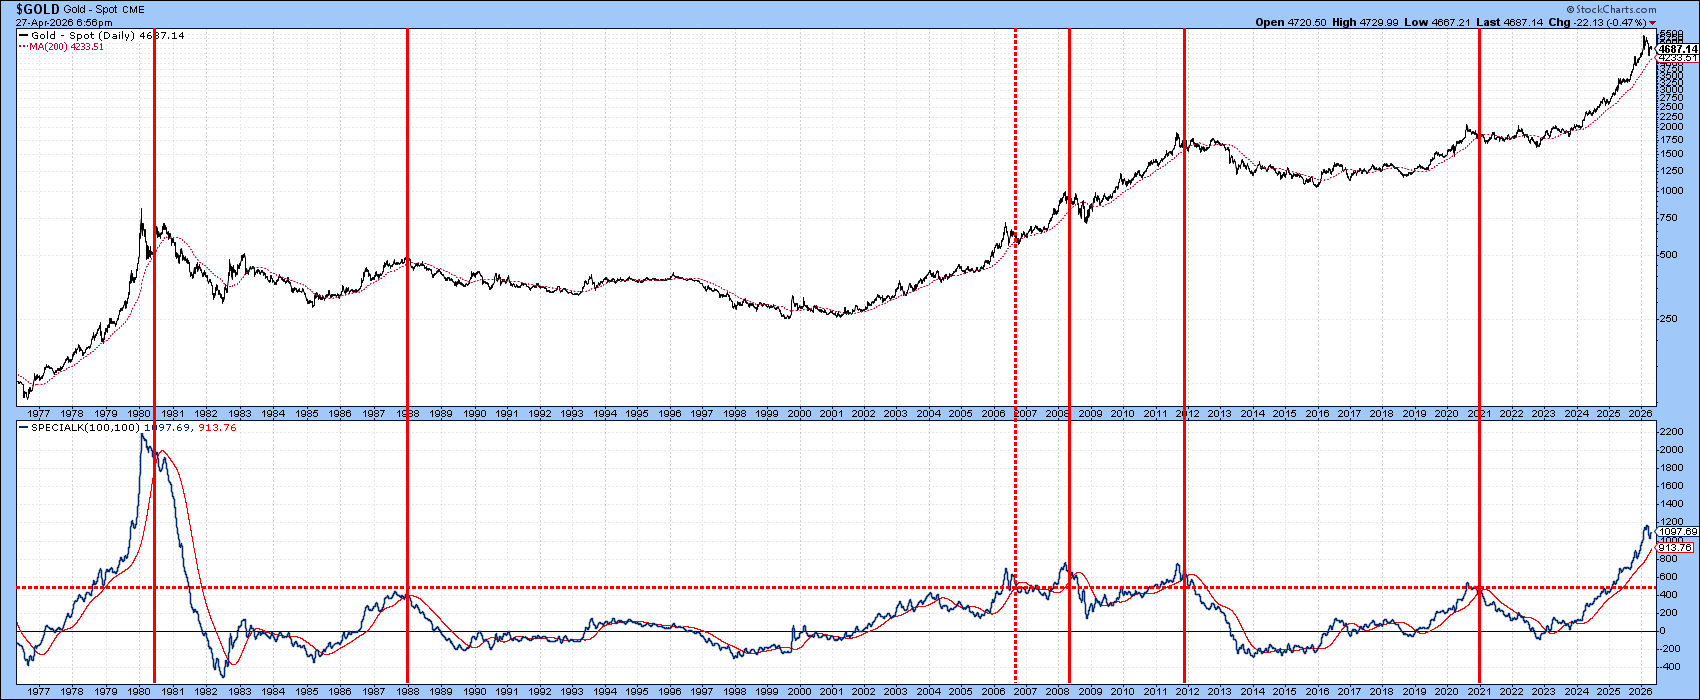
The Special K indicator in Chart 3 tells a similar story. It is still just above its signal line, but past spikes that crossed from extreme levels usually marked major tops. The setup is ready; the trigger has not yet fired.
Silver Looks Bad Too
When the 18‑month Rate of Change (ROC) for any market (except volatile stocks) drops from above +200%, history shows a big peak that often won’t be beaten for about 15 years. Chart 4 shows this ROC falling from that level for the fourth time in 50 years. Two of those times marked long‑term tops, and one gave a quick, short‑lived bounce.
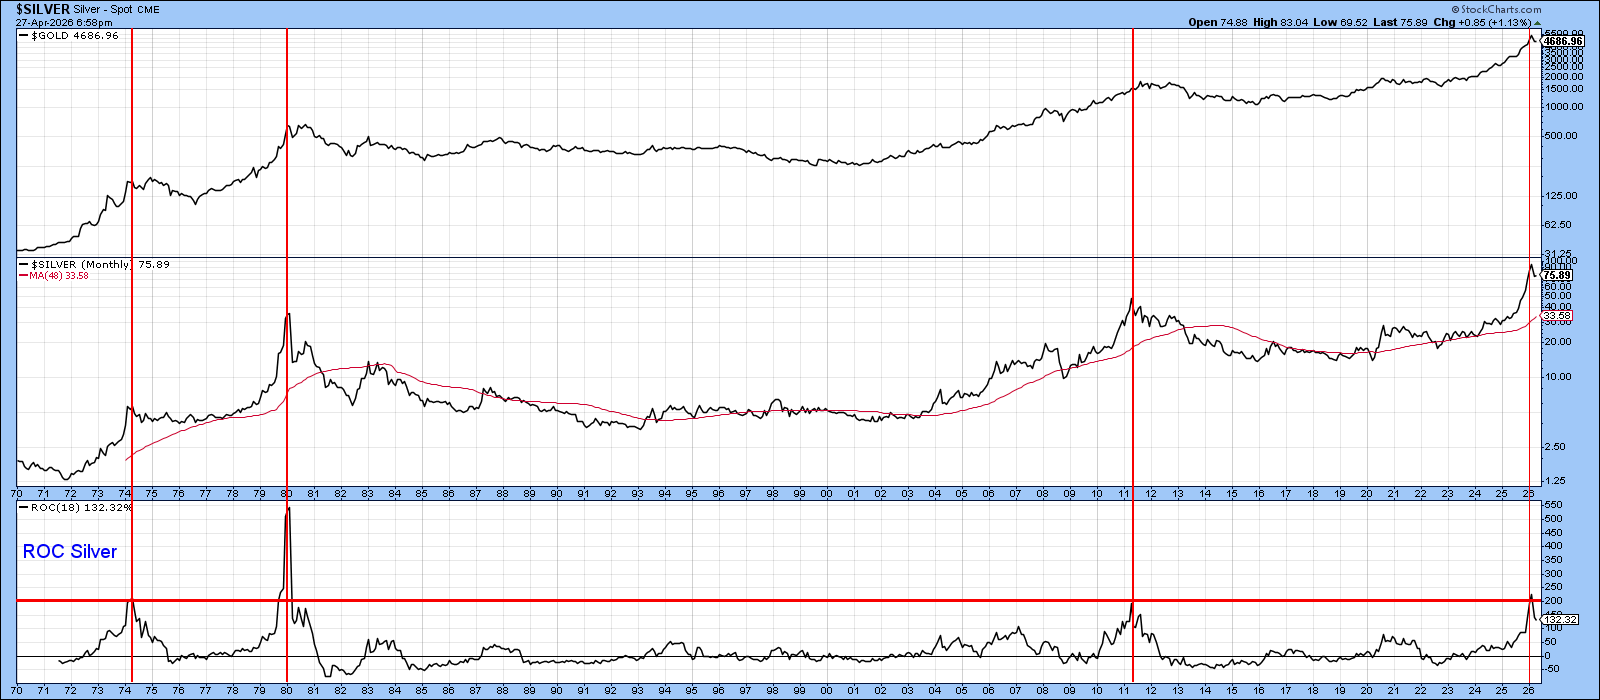
The top chart shows gold price, and gold and silver have moved together. All three earlier ROC drops started with silver but also signaled gold tops. This new signal therefore warns about both metals.
Gold ETFs Show Similar Patterns
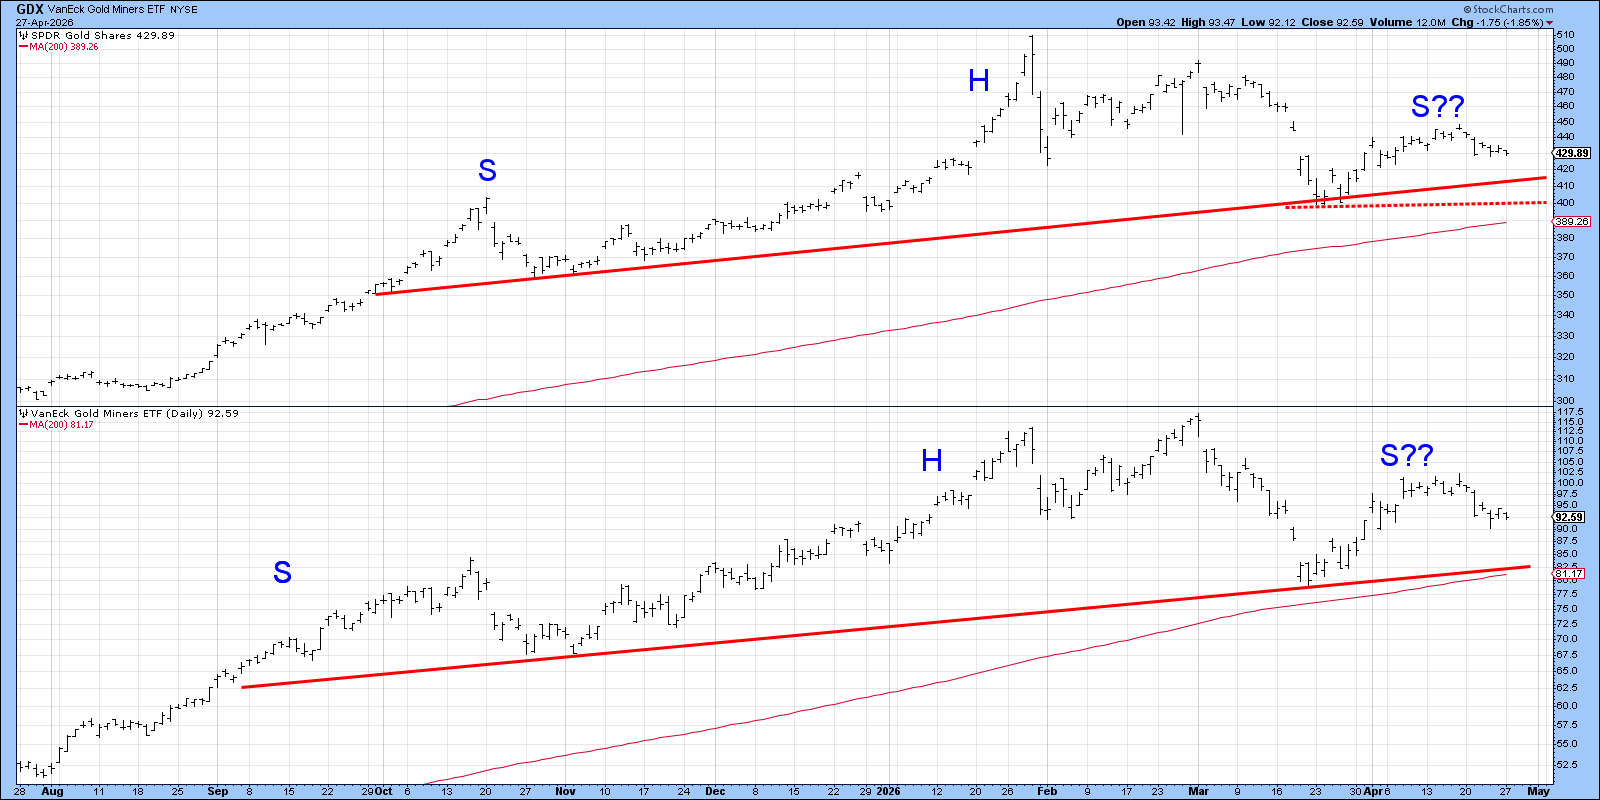
Chart 5 looks at the SPDR Gold Shares ETF (GLD) and the VanEck Gold Miners ETF (GDX). Both charts seem to be forming head‑and‑shoulders tops. For GDX, the neckline and the 200‑day moving average meet around $81, creating a key support zone. For GLD, the neckline sits near $415, with another support level at $400, which was the low in March.
Bottom Line
A yellow flag is waving. If GLD falls below $415 and stays there, the referee will likely raise a red card.
Source: Materials provided by https://articles.stockcharts.com.Note: Content may be edited for style and length.