

Before we start…
Earlier we looked at what “smart money” does. Now we will focus on everyday investors. How do they feel about the market? What if you could see their mood each week? Would you follow the crowd or trade against it?
That choice is yours. The good news is that you can measure the mood. A tool exists, and we will show you how it works.
The American Association of Individual Investors (AAII) is a non‑profit that runs a weekly poll of its members. The poll asks a simple question:
“Do you think the S&P 500 will go up, down, or stay the same over the next six months?”
Answers are grouped into three numbers: bullish (up), neutral (stay), and bearish (down). StockCharts lets you draw these numbers on a chart so you can watch them change.
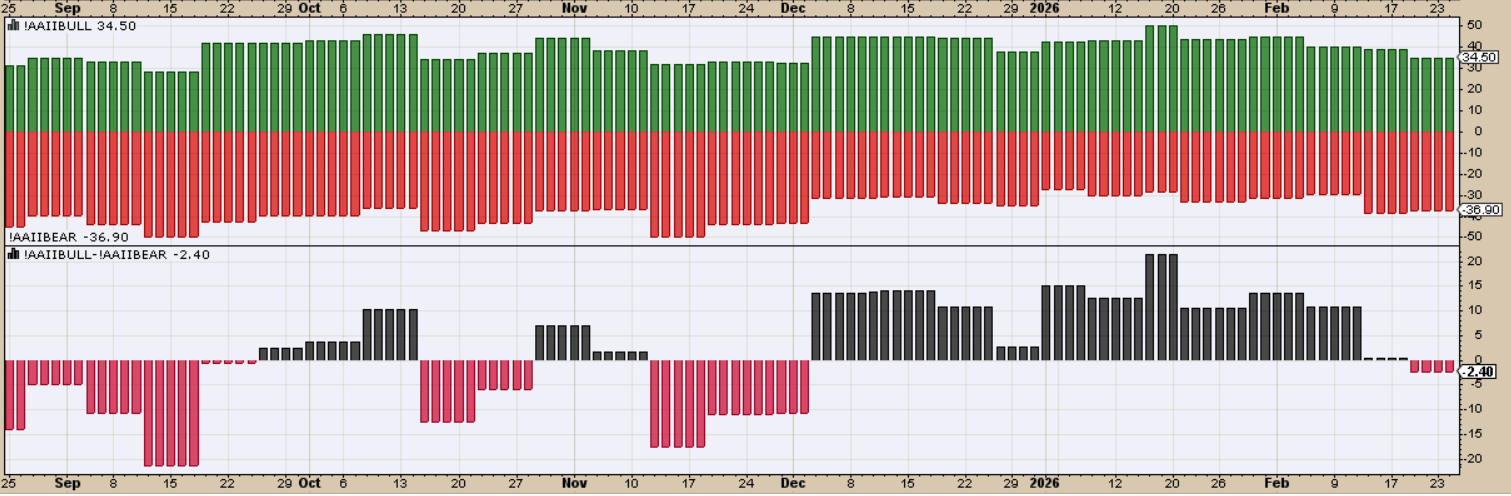
Each bar in the picture shows one week of results.
- !AAIIBULL vs !AAIIBEAR: Green shows the % of bullish answers, red shows the % of bearish answers. You can see optimism rise or fall.
- !AAIIBULL minus !AAIIBEAR: This line subtracts bearish from bullish. When it’s above zero, optimism wins; below zero, fear wins.
Remember, these numbers do not tell you when to buy or sell. They simply add a psychological layer to the price chart.
In strong up markets, bullish numbers rarely go above 60 %. In sharp down markets, they rarely drop below 20 %.
How to Use the Data
First, decide if the market itself looks bullish or bearish. Then check how retail investors feel about that structure.
For the example below we add an Ichimoku Cloud to show the overall trend. (The 40‑week moving average works like a 200‑day average.)
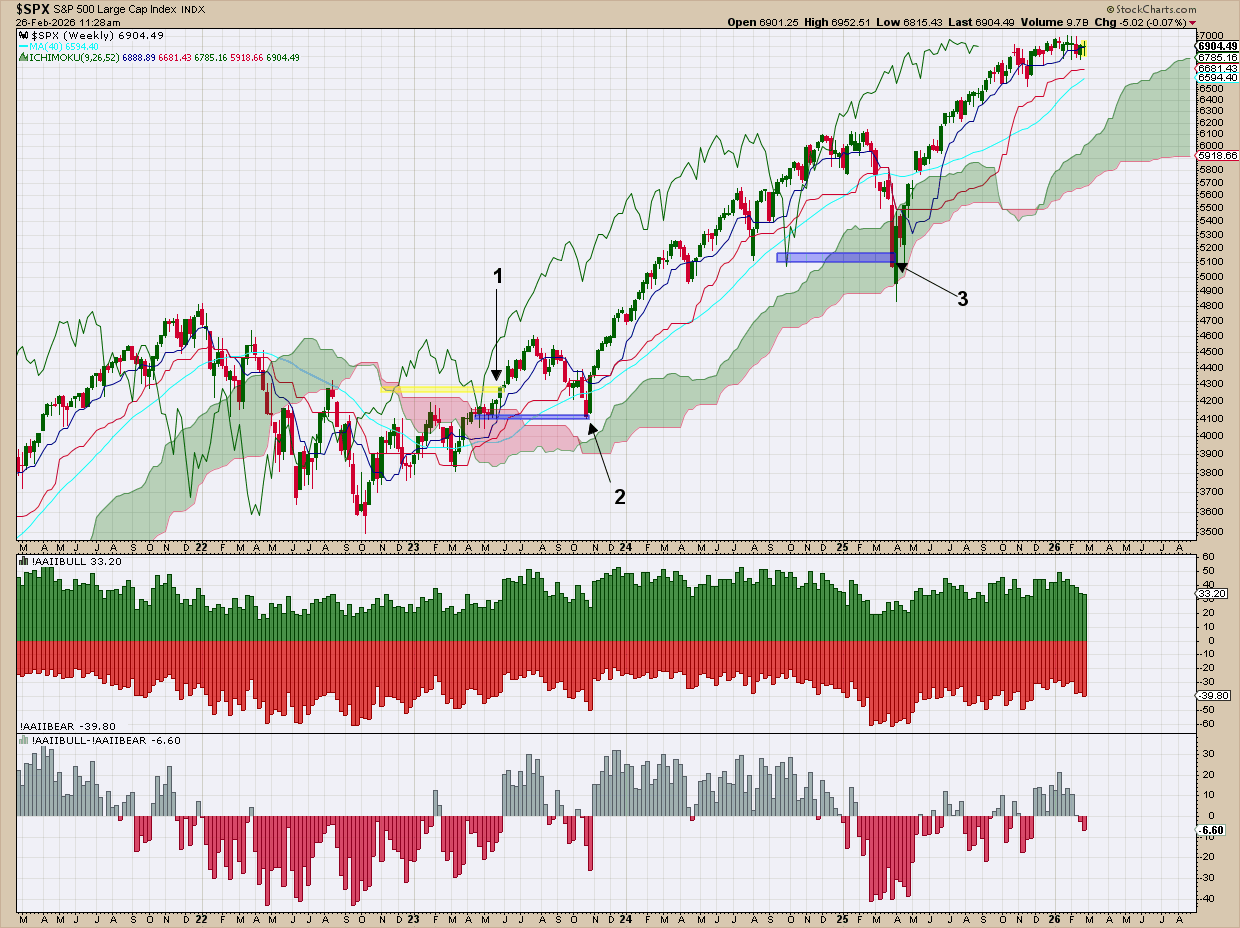
1. The Breakout No One Believed
- Price jumps above the previous high.
- The cloud turns green.
- The Chikou Span (the lagging line) moves above price from 26 weeks ago.
Even though the price is breaking out, the AAII poll still shows a net bearish mood. That tells us retail investors are lagging behind the market move.
2. The “Is It Failing?” Pullback
- Price falls below the 200‑day level.
- Retail sentiment flips back to bearish.
- Fear rises.
The price stays above the cloud, which means the overall structure is still bullish. When sentiment turns sour in a still‑healthy uptrend, it can create a good “buy‑the‑dip” chance.
3. The Real Scare
- Price drops well under the 200‑day line.
- The Chikou Span falls below earlier price.
- AAII shows several weeks of bearish readings.
Now the fear makes sense. After the market stabilizes near the cloud, the uptrend resumes and retail sentiment slowly improves.
Key Takeaways
Retail sentiment does not always lead market turns, but it reacts quickly to volatility. Extreme readings are better at showing risk conditions than timing tops or bottoms.
- If the market is bullish but sentiment is very bearish, a hidden opportunity may exist.
- If sentiment is overly euphoric while the market structure weakens, that’s a warning sign.
AAII vs. NAAIM – Same Mood, Different Money
AAII tells you how individual investors feel. The NAAIM Equity Exposure Index tells you how professional managers are positioned. When both move together, nothing special happens. When they diverge, the clash can hint at a change in risk.
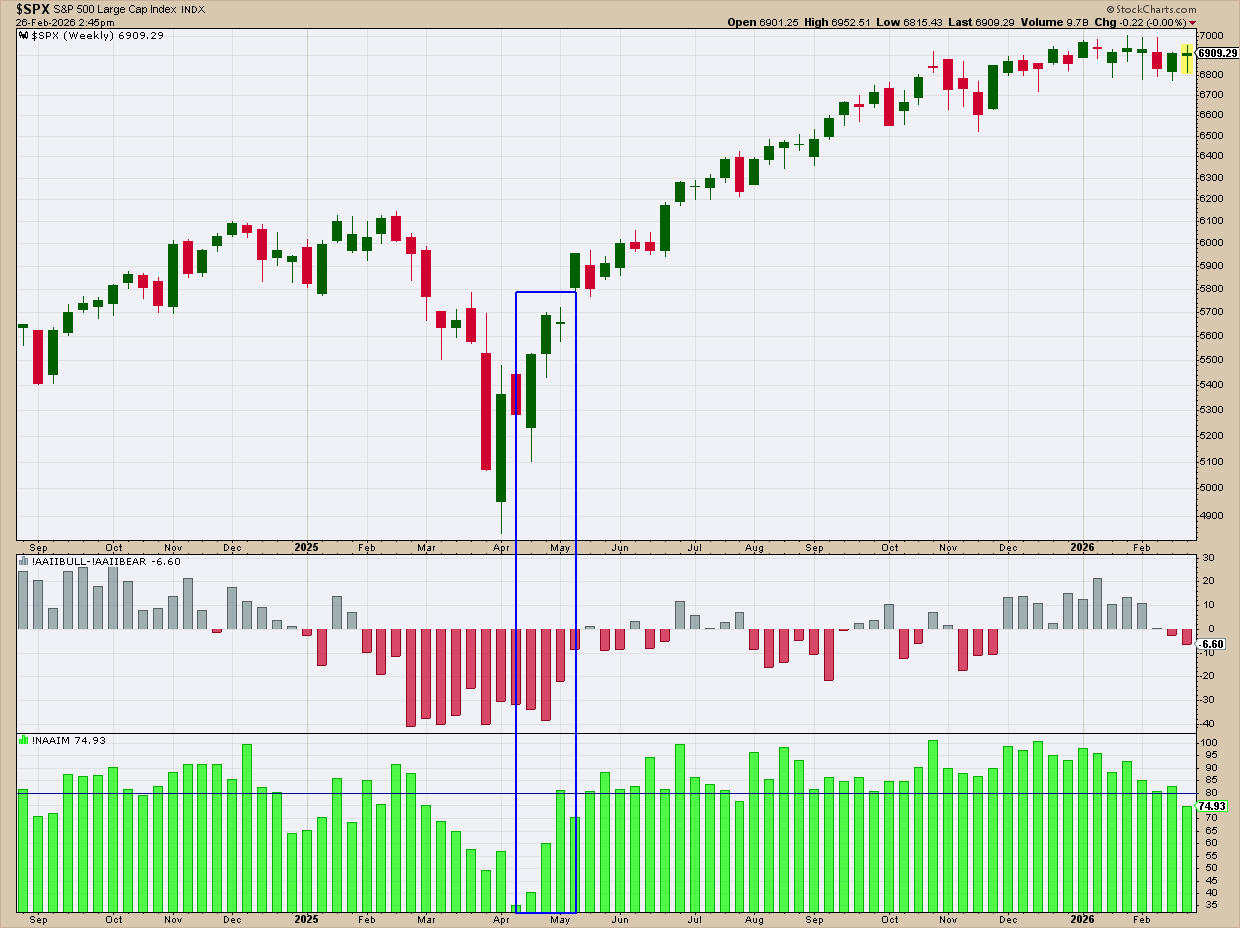
In the picture, the NAAIM line jumps above 80 while AAII still shows net bearish sentiment. Price is bouncing off a low. The gap between manager money and retail mood signals a possible shift.
Bottom Line
AAII will not shout “buy” or “sell,” but it helps you see when fear builds inside a strong market or when optimism creeps into a weak one. When sentiment and price move together, trends tend to hold. When they pull apart, the risk environment may be changing. Use this insight to decide whether to follow the crowd or move a different way.
Source: Materials provided by https://articles.stockcharts.com.Note: Content may be edited for style and length.