

Quick Intro
StockCharts offers two charting tools. Each one shines in a different way. Knowing which one matches your trading habit can save you time and help you see the market clearer.
Two Tools, Two Speeds, One Goal
SharpCharts gives you a single, high‑resolution picture of a market. It comes with many drawing tools, but the view stays still. The Advanced Charting Platform (ACP) shows many charts at once and updates in real‑time.
The first tool lets you dig deep into one chart. The second lets you glance at many charts quickly. Your choice depends on whether you prefer a slower, deeper look or a fast, big‑picture scan.
Who Should Use Each Tool
SharpCharts – The Detail‑Oriented Analyst
Pick SharpCharts when you want to study one chart without distractions. It works well for:
- Spotting patterns such as trend lines or classic formations
- Running slower indicator studies
- Polishing swing‑trade ideas
- Creating clean charts for reports or lessons
The static image can be saved as a PNG, making it easy to paste into presentations. Think of it as a magnifying glass for a single chart.
ACP – The Fast‑Paced Technician
Choose ACP when you need many charts at once and want them to move with the market. It shines for:
- Quick intraday decision making
- Viewing several timeframes side by side
- Keeping watchlists up to date as prices shift
With up to twelve panels, ACP gives you a live workspace that static charts cannot match. It’s like having a live dashboard of the market.
Where Each Tool Excels
SharpCharts for Depth
Below is a simple SharpCharts example. The chart shows the SPY ETF with a few common tools: an RSI for momentum, a Chaikin Money Flow line for buying pressure, a 200‑day moving average for trend direction, and a Fibonacci retracement to hint at possible reversal zones.
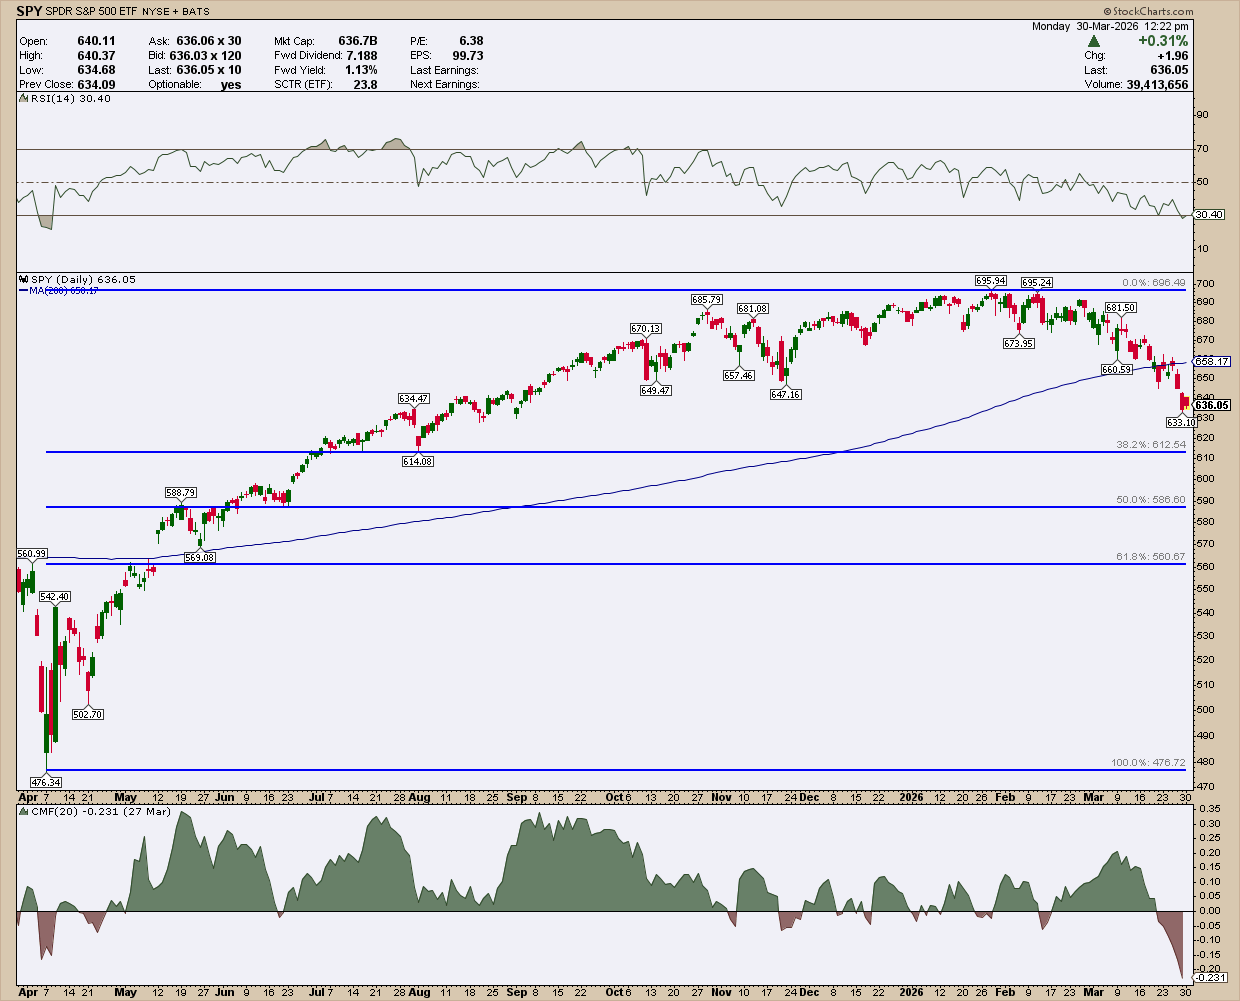
This static view is easy to export and explain to others. The slower pace helps you stay focused on analysis instead of chasing every tick.
ACP for Speed and Context
Imagine you want to watch three timeframes at once: a 15‑minute chart for entry timing, a daily chart for short‑term trend, and a weekly chart for long‑term outlook. ACP lets you line them up in one window.
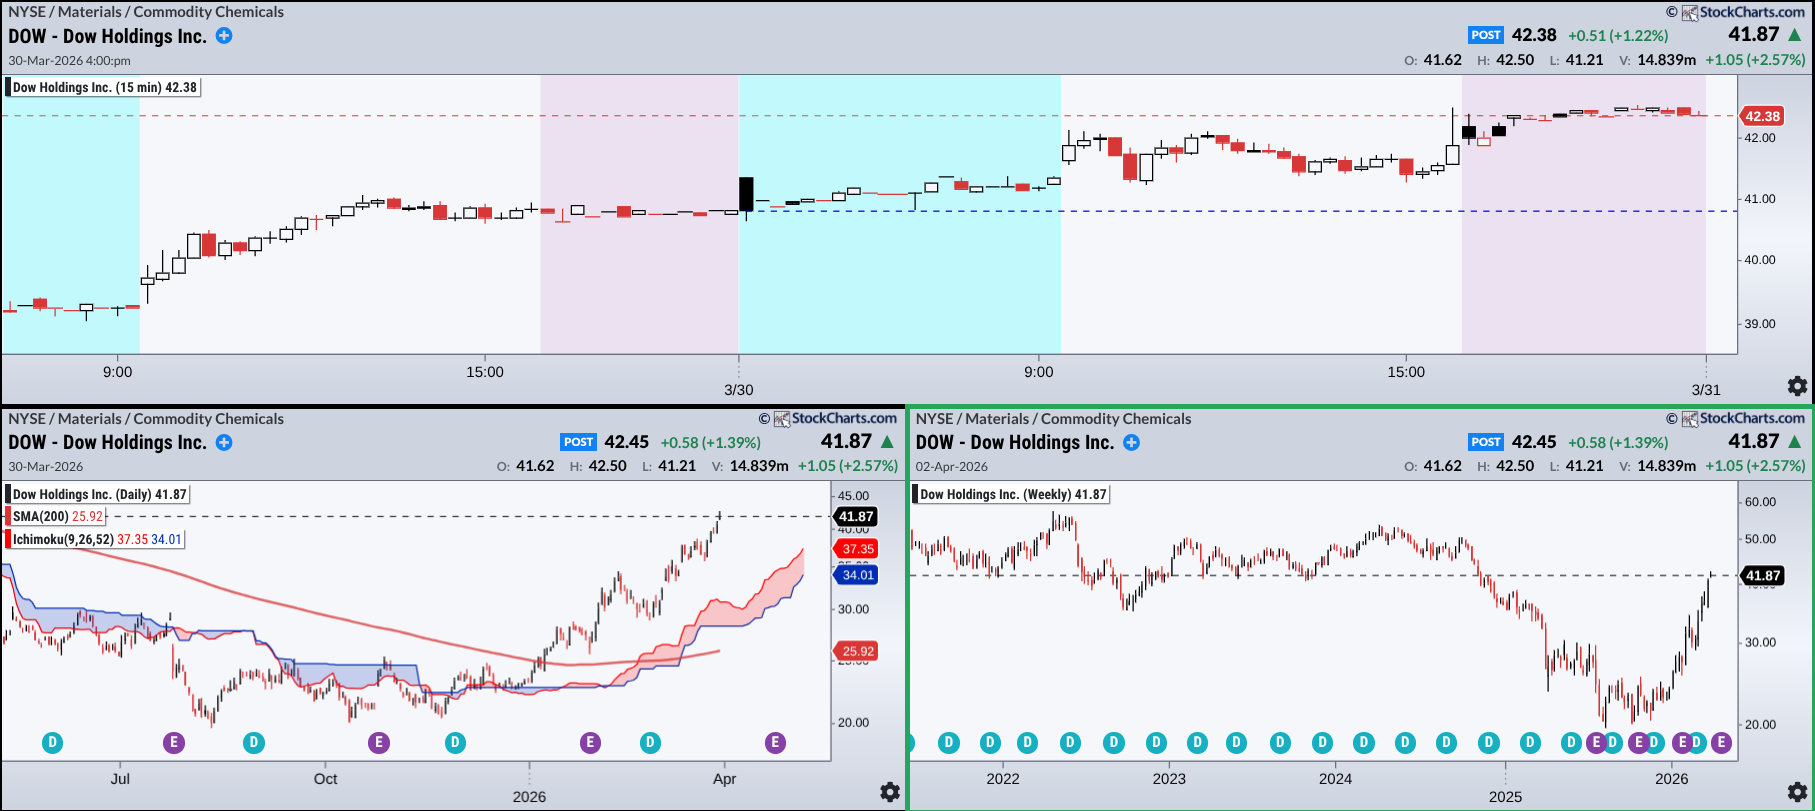
In this set‑up, the fast chart shows a tight range that could break up or down. The daily view shows nearby swing lows for possible stop placement, while the weekly view flags a level that might turn from support to resistance.
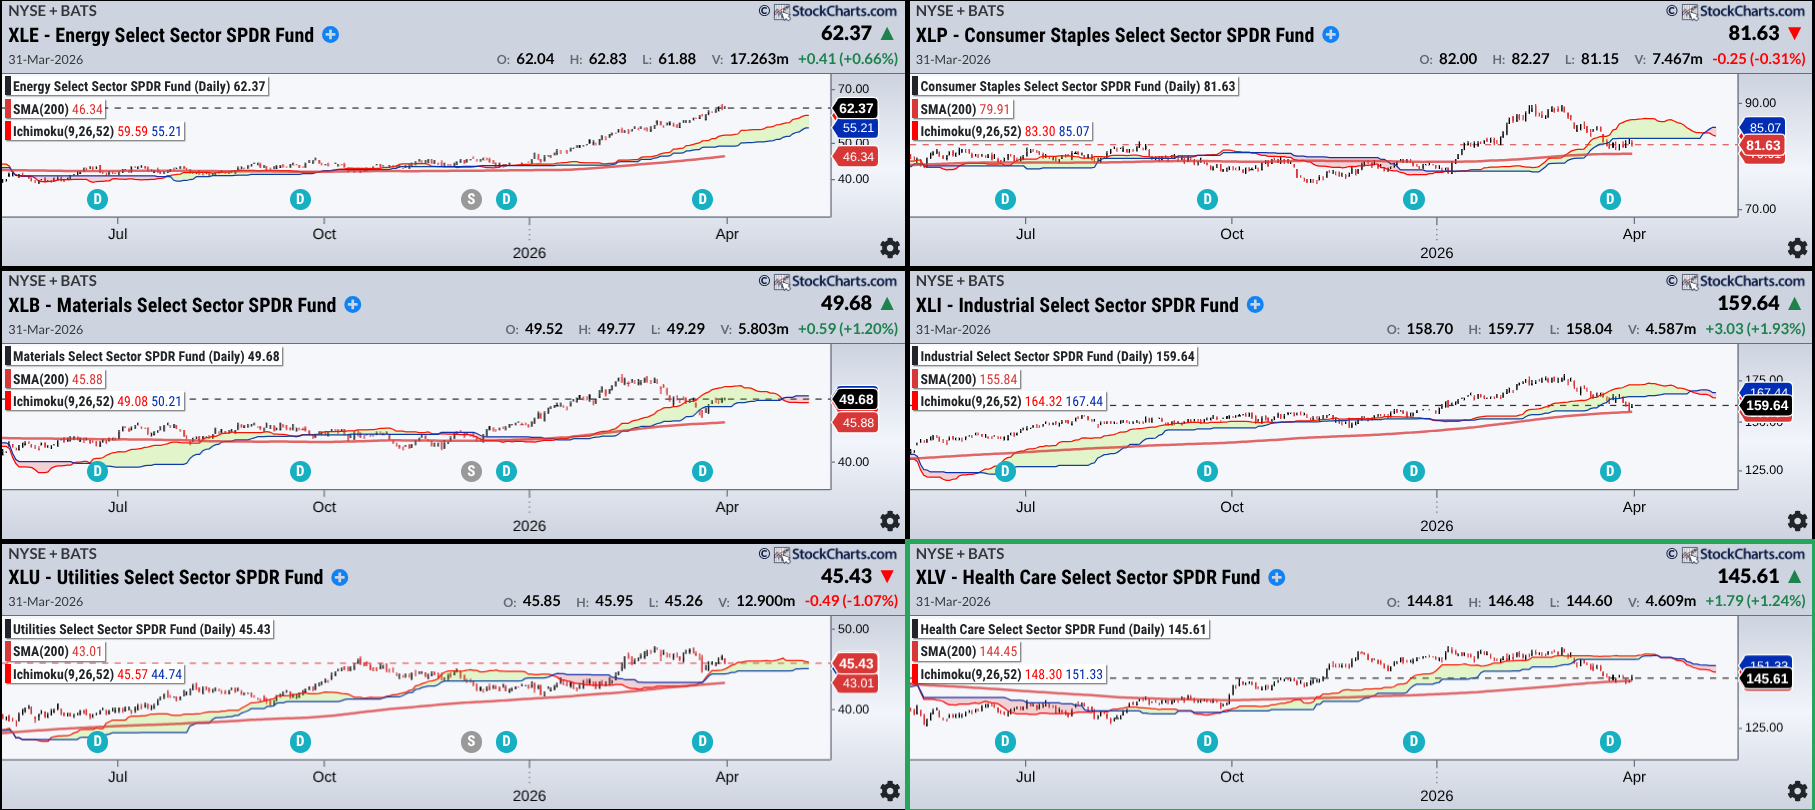
Another ACP example tracks the six biggest sector ETFs with a 200‑day SMA and an Ichimoku Cloud. The left side highlights which sector looks strongest, while the right side warns of potential resistance when the price is below the cloud.
Insider Tip: Pair Both Tools for an Edge
You can get the best of both worlds by moving between the platforms:
- Scan & Spot – ACP: Use the live dashboard to find interesting moves.
- Deep Dive – SharpCharts: Pull a single chart, add indicators, and confirm the setup.
- Trade & Watch – ACP: Follow the trade in real‑time and adjust alerts.
- Review – SharpCharts: After the trade, export the chart to study what happened.
This back‑and‑forth prevents “analysis paralysis” from too many screens, while still giving you quick market awareness and thorough study time.
Wrapping Up
SharpCharts and ACP are not rivals; they complement each other. Knowing when to slow down with SharpCharts and when to speed up with ACP can turn market noise into clear signals. Use the right tool at the right moment, and your trading decisions will become sharper and more confident.
Source: Materials provided by https://articles.stockcharts.com.Note: Content may be edited for style and length.