The CAC40 cash index ended the session higher, gaining 2.10% to reach 7,981.27 points. Trading volume was strong, about €5.27 billion.
The Paris stock market moved up even though the Middle East remains uneasy. Tensions there keep energy markets and sovereign debt under pressure. Recent events – a new Houthi conflict, extra troops in the region, and ongoing disruptions in the Strait of Hormuz – have made investors nervous.
Some calming signs appeared. Former US President Donald Trump hinted he might end the American offensive in Iran, while Iran’s president gave signals of willingness to ease tensions. Oil prices fell to about $101 per barrel for Brent and $99 for WTI.
Because oil fell, TotalEnergies dropped 4.14% to €77.56. The bank sector led the gains on the CAC40: Crédit Agricole rose 4.08% to €16.58, BNP Paribas up 5.42% to €85.38, and Société Générale climbed 6.80% to €65.96.
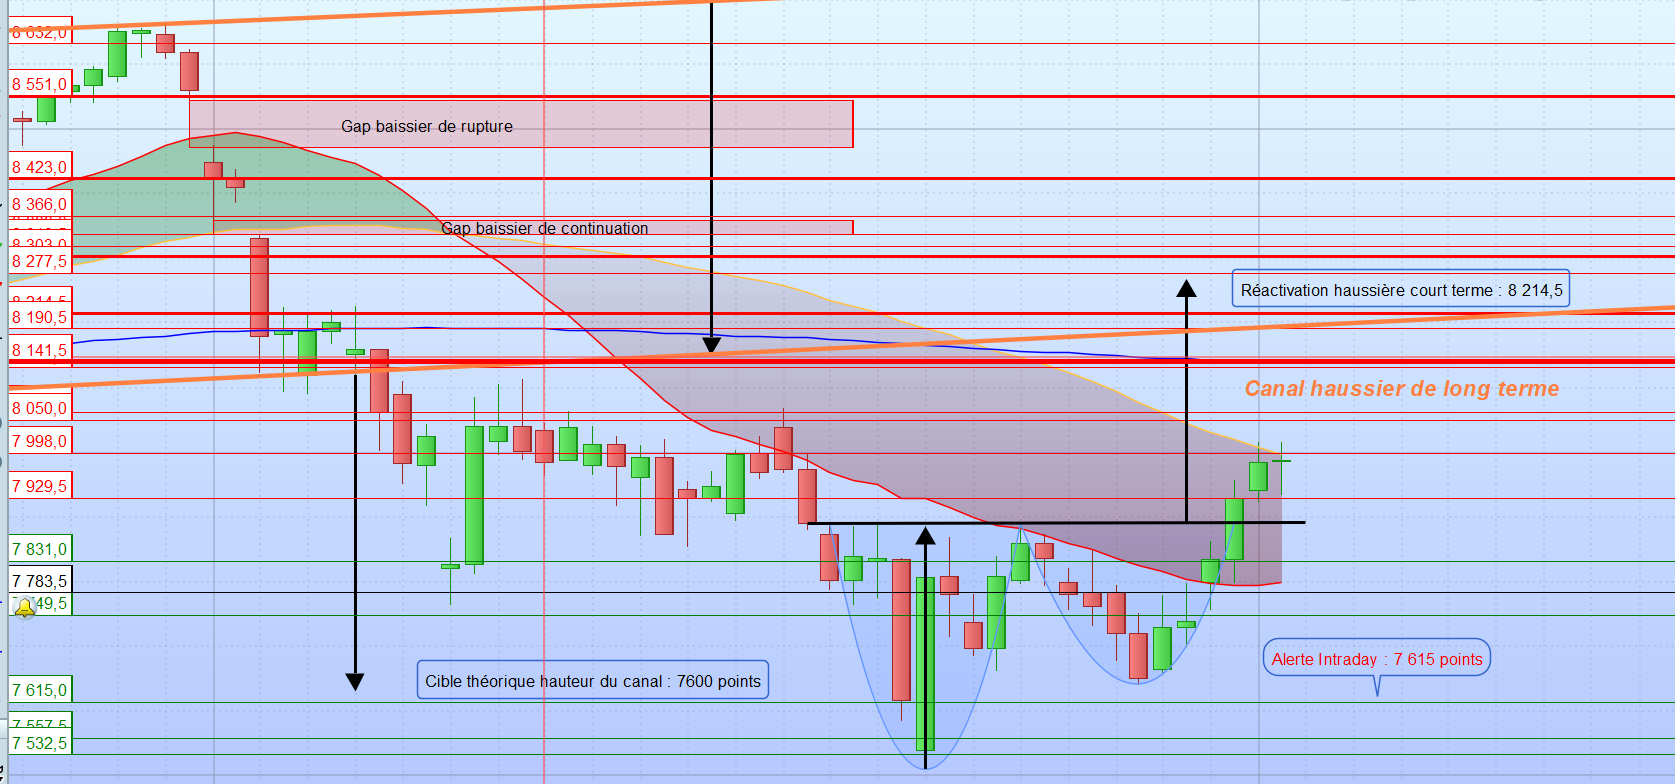
Future contract (April) – key levels
Resistances: 7,929.5 – 7,998 – 8,050 – 8,062 – 8,131.5 – 8,190 – 8,214.5 – 8,277.5 – 8,303 – 8,338 – 8,366 – 8,423 – 8,551.
Supports: 7,831 – 7,749.5 – 7,615 – 7,557.5 – 7,532 – 7,398.5.
In intraday trading, the bias is bullish above the 7,730‑point level.
Technical picture
At 2 pm, the CAC40 future showed its sixth consecutive rise. A “bullish hammer” candlestick formed, indicating that buyers pushed the price back up after a low dip. Earlier, a “cup with handle” pattern had formed on Monday. This morning the handle broke upward with strong volume, suggesting a possible target near 8,277 points.
If the index breaks the intermediate resistance at 7,998 and then 8,050, the upward momentum could strengthen. A smoother geopolitical situation, such as a cease‑fire, would help the index stay in its long‑term upward channel, whose lower bound is around 8,212 points.
On the downside, a drop below the cup‑handle neckline at 7,892 points would signal weakness. The price could then move toward the 7,600‑point area, which aligns with the old bullish channel. Breaking that level might push the index toward further supports at 7,557.5 and 7,398.5 points.
Indicators
The index trades above its 20‑day moving average but below the 50‑ and 200‑day averages. The MACD histogram is rising yet stays below its signal line. The RSI reads neutral, and volumes are lower than the previous session.
Conclusion
Because the market is still shaped by geopolitical news, the outlook stays positive as long as the index remains above the low points of March 23. Long‑term portfolios keep bullish positions, with opportunistic additions to names like ABN Amro, BAM Groep, and Ferrovial when technical signals appear. Some profit‑taking may be considered if the index approaches the lower edge of its historic upward channel.