
CAC40 Ends Day Lower
The French CAC40 index finished the session at 7,962.39 points, down 0.24%. Trading volume was high, about 3.894 billion euros. Over the last week the index has risen 3.38%.
Why the Market Moved
The market tried to stay positive after news of a possible deal between Iran and Oman to keep the Strait of Hormuz open. The news helped a little, but investors are still nervous because of ongoing geopolitical risks.
U.S. President Joe Biden mentioned the chance of large‑scale bombings of Iran within the next two to three weeks. He said the U.S. is close to its goals but did not give details. This unclear message keeps traders on edge.
Some traders took profits, while others were disappointed by the news. A small bounce appeared when the market hoped the Hormuz Strait might reopen, but the gain is fragile.
Commodity and Currency Movements
Crude oil (Brent) kept climbing, now about $107 per barrel, a rise of roughly 6%. The U.S. dollar slipped a bit against the euro, trading at 1.1550. The 10‑year U.S. Treasury yield ended at 4.305% after briefly touching 4.39%.
Technical Outlook for April Futures
Resistance levels (price points where the market may stop rising): 7,983; 8,050; 8,062; 8,131.5; 8,190; 8,214.5; 8,277.5; 8,303; 8,338; 8,366; 8,423; 8,551.
Support levels (price points where the market may stop falling): 7,836; 7,749.5; 7,615; 7,557.5; 7,532; 7,398.5.
For today’s trading, the bias is bullish if the index stays above 7,841 points.
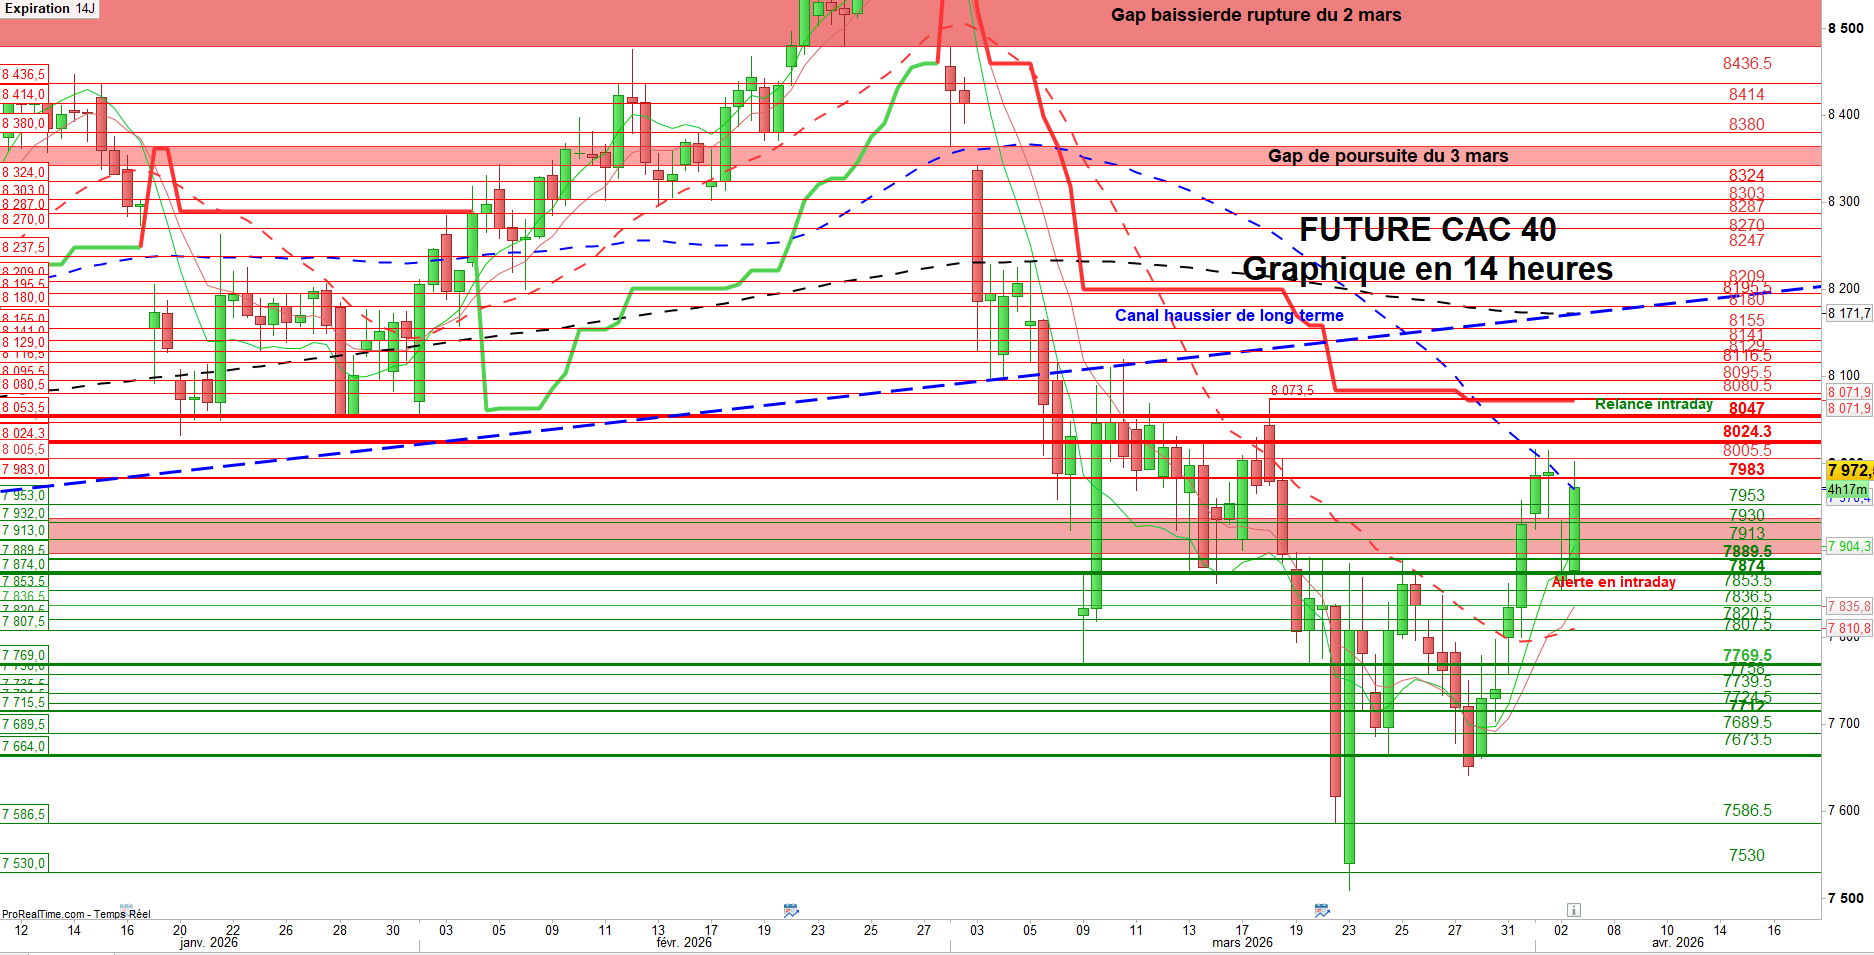
Chart Summary (14‑hour data)
The CAC40 future showed a small rise after a recent bounce. On March 30 the index found support at the bottom of a range between 7,690 and 7,880 points. It broke that range on March 31 and held steady today.
Two gaps are important:
- A gap up on April 1 was partly filled.
- A gap down from today was completely closed.
These moves suggest the market still has buyers. A stronger rally would need the index to pass the April 1 high of 8,016.5 points. Breaking the March 18 peak of 8,073.5 points would add more confidence. The long‑term uptrend could return if the index climbs back above the range’s upper band.
If the market fills the April 1 gap and falls below 7,850.14 points, the short‑term bounce could weaken. A further drop below the 20‑period moving average (about 7,805 points) would be a negative sign. Since early March, the index has struggled to stay above this level after U.S. and Israeli air strikes on Iran.
Indicator Check
The MACD histogram is in overbought territory, while the RSI shows a slight pull‑back but stays in the upper range. Trading volume remains relatively strong.
What May Happen Next
If the index falls under the 20‑day moving average, it could slide toward the lower range at 7,690 points. A break of that support might push the price toward the March 23 low, indicating a possible correction.
Overall, the chance of a short‑term rebound is still alive. This supports a cautious increase in positions for dynamic and investor portfolios, while staying ready to adjust if technical signals turn negative.