
CAC 40 Market Summary
The CAC 40 cash index closed 1.14% lower at 8,235.72 points, with a strong €4.031 billion trading volume.
Geopolitical backdrop
The Paris market took a breather while investors watched the Iran cease‑fire talks that should end on Wednesday night. If fighting continues, the hope of reopening diplomatic talks helps calm the market.
The United States sent a delegation led by J. D. Vance to Islamabad. Tehran has not confirmed its own participation, but Bloomberg says Iran may send representatives, keeping the chance of new talks alive.
Oil price impact
Brent crude fell back under $95 a barrel. Lower oil prices ease pressure on risky assets, including stocks.
Other market drivers
Investors also look at upcoming company earnings and the Senate hearing of Kevin Warsh. Warsh, a possible Fed chair named by Donald Trump, must show he can act independently of politics. Recent criticism of Jerome Powell adds to the uncertainty.
Inflation worries, especially from energy costs, make the monetary calendar more uncertain. The market no longer expects a quick rate‑cut, and Warsh will have to explain how to handle a more volatile inflation outlook.
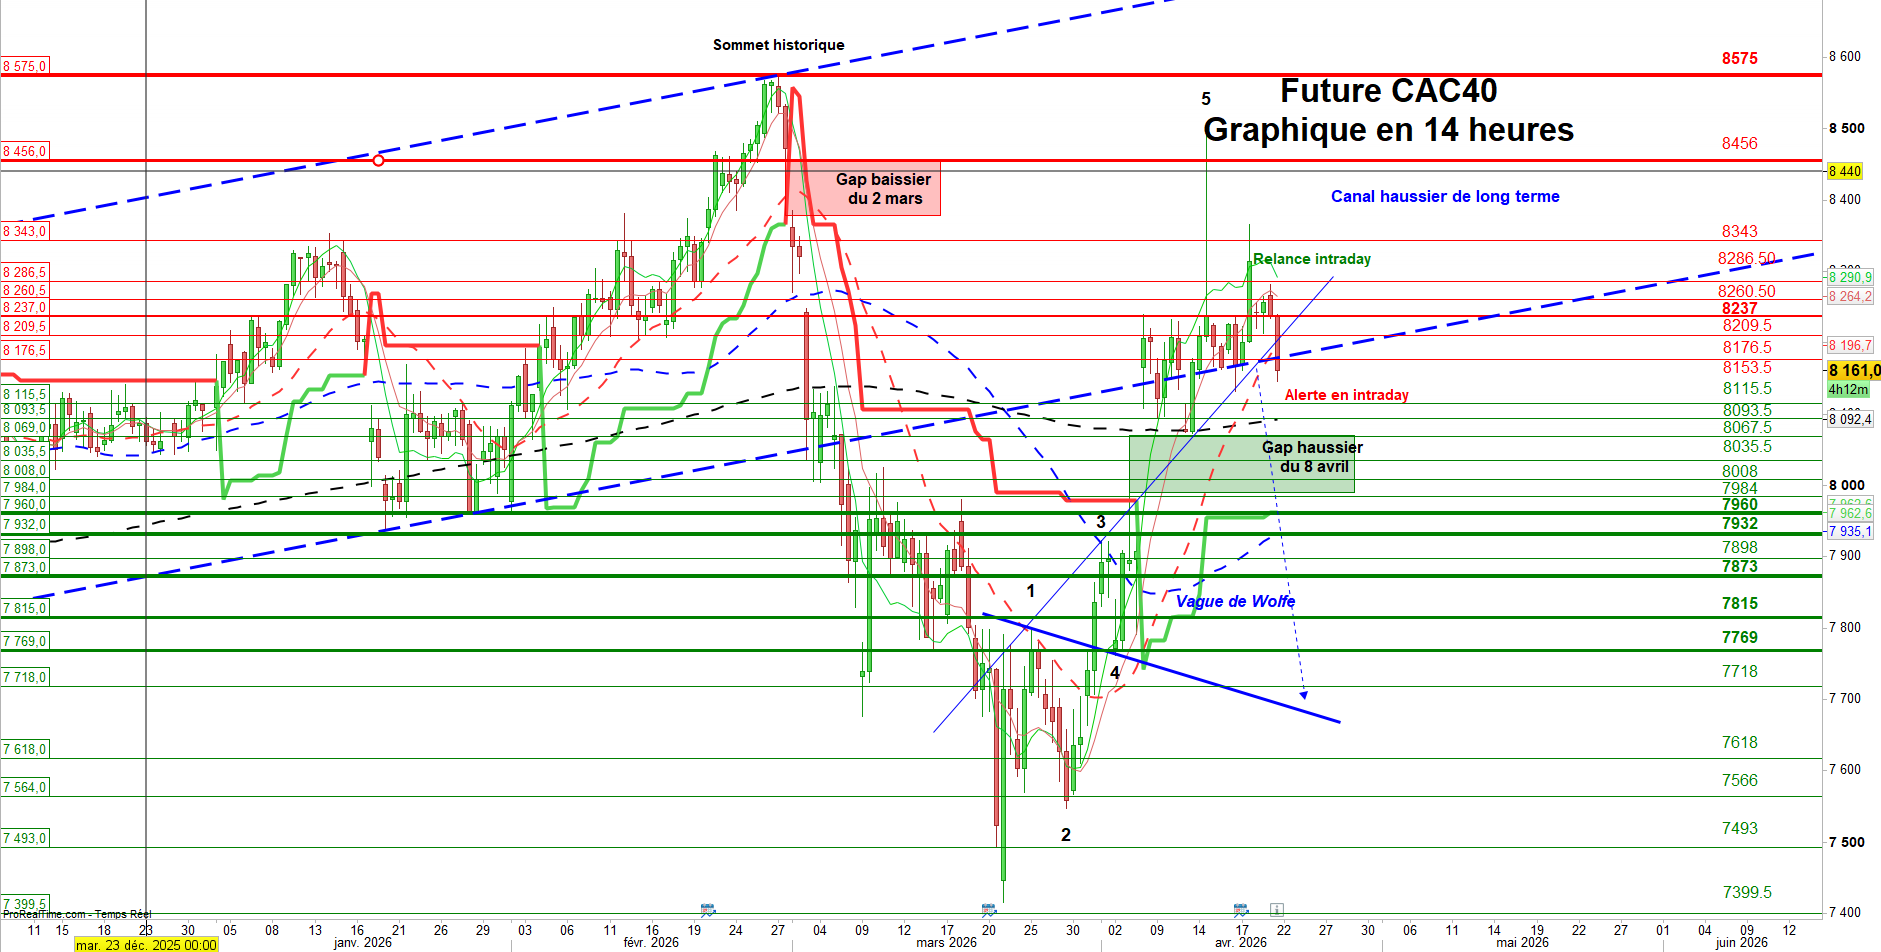
May CAC 40 Futures – Key Levels
Resistance points: 8,176 – 8,210, 8,237, 8,286, 8,343, 8,466, 8,912, 8,434.
Support points: 8,115.5, 8,090, 8,066, 8,048.5, 8,020, 7,960, 7,843.5, 7,768.5, 7,676, 7,512.5, 6,999, 6,467.
When the index falls below 8,247 points, the short‑term bias turns bearish.
Technical picture (14 h data)
The chart still shows a bullish bias. The lower edge of the long‑term ascending channel sits near the 20‑period moving average at about 8,199 points. An intraday alert zone around 8,115 points has acted as support in recent days, confirming the strength of these levels.
A decisive step is still needed: the market must close the bearish gap from the March 2 break, which sits between 8,161.75 and 8,553.94 points. After that, a new all‑time high would confirm the upward momentum.
Indicators
The MACD histogram is now close to the zero line, showing momentum losing steam. The RSI is in a neutral zone. Trading volume has fallen compared with last week, indicating a more measured investor approach.
What could trigger a reversal?
If the price stays below the long‑term channel’s lower boundary (under 8,175 points) and then breaks the intraday alert level of 8,115 points, sellers may take control. In that case, the Wolfe Wave target would be around 7,685 points.
Conclusion
Near historic highs, entry points become scarcer because the risk‑reward ratio is less attractive. We recommend a waiting stance while staying ready to act when clear chart patterns appear. New highs would open more upside and could justify a more aggressive portfolio, whereas a fall below the long‑term channel’s lower edge would be a warning to reduce exposure.