

Risk‑on signals are growing. Sectors like Discretionary and Biotech are beating their defensive peers. Even the Dow Hotels index hit a 52‑week high. All of this comes after the S&P 500 formed a clear V‑bottom.
Bitcoin Returns to the Spotlight
Bitcoin, the biggest cryptocurrency, rose above $78,400 – a level not seen since early February. After falling to a low in early February, the coin has earned about a 30% gain.
This early spring rise gives crypto bulls a nice boost. Higher prices in Bitcoin and Ethereum could also help the tech side of the stock market.
Breaking Above Key Resistance
The climb past $78,000 matters because it is above the March high of $76,000. On a longer view, the $80,600 mark from last November acts as a strong barrier.
Another important line is the 200‑day moving average, sitting in the mid‑$80,000 range.
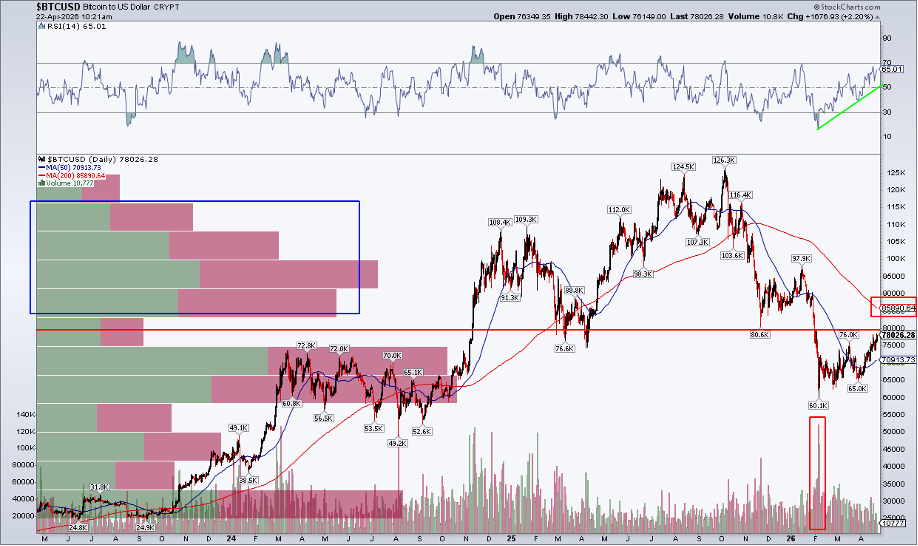
The RSI (a momentum tool) has risen from deep oversold levels in February to just under the overbought zone. A reading above 70 does not mean a sell signal; it usually tells traders to look for dips to buy.
What Volume Is Saying
When Bitcoin fell on February 6, a huge amount of coins changed hands, which helped create a solid bottom. The volume‑by‑price picture shows many buyers are still holding positions below the current price.
If new buying shows up with higher volume, it could push the price above the 200‑day line and attract more interest.
Key Support Zones
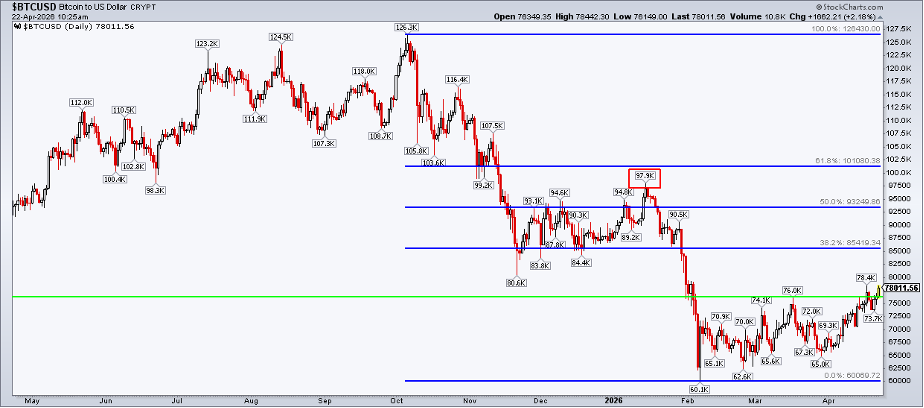
A previous analysis highlighted a $58,000 Fibonacci level. New Fibonacci calculations now point to a 38.2% retracement around $86,000, right near the 200‑day average.
Mark these three levels: the February low, the 200‑day average, and the $86,000 Fibonacci point.
Watch for a Possible Fake‑Out
The March high of $76,000 must stay intact. A similar rise in early January to almost $98,000 later failed, so traders should be cautious of a short‑lived bounce.
Bitcoin vs. Gold
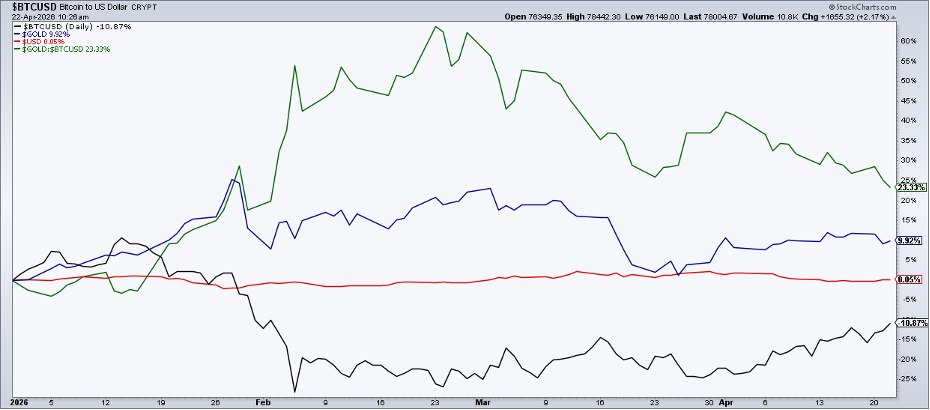
Comparing Bitcoin to gold shows who is leading the market. Gold is still up about 10% year‑to‑date, but the gap between gold and Bitcoin has narrowed from 60 percentage points in February to about 23 now.
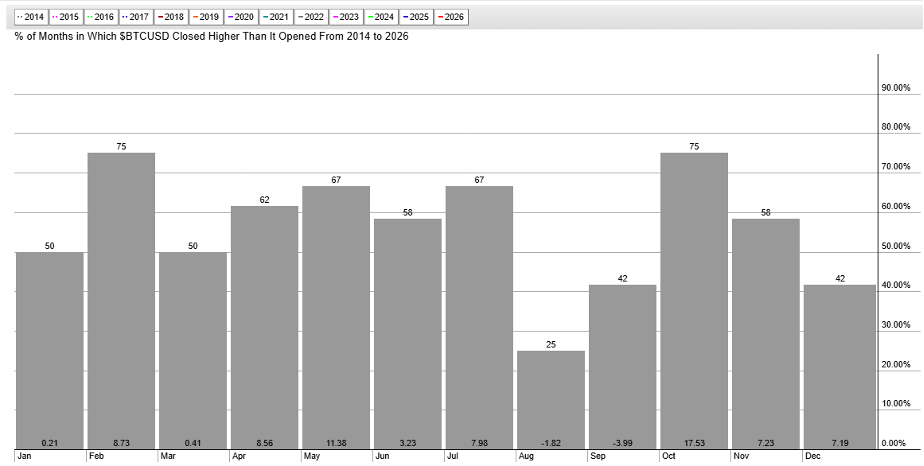
Seasonal Strength
Historically, Bitcoin performs well in April and May, the second‑best two‑month period after October‑November. Median returns from April to July are +11%, +7%, +4%, and +9%.
Bottom Line
Bitcoin is moving higher and has gained some positive sentiment around Earth Day 2026. Important technical levels sit above today’s price, and the pattern of higher highs and higher lows, along with a strong RSI, suggests more upside may be possible.
Disclaimer: This content is for educational purposes only and does not constitute financial advice.
Source: Materials provided by https://articles.stockcharts.com.Note: Content may be edited for style and length.