

The market got shaky in March. Tensions around the world rose, energy prices jumped, and interest rates went up. Even with all that, the S&P 500 is still close to its recent highs.
SPY Holds Up Best as Small‑Cap Funds Fall
During the last two weeks the SPDR S&P 500 ETF (SPY) fell about 4 % from its January peak. The Nasdaq‑100 ETF (QQQ) dropped a little more and the small‑cap ETF (IWM) fell over 8 %.
Small‑cap stocks took the biggest hit, while SPY stayed the strongest. A drop of less than 5 % is still a short‑term pull‑back inside a long‑term uptrend.
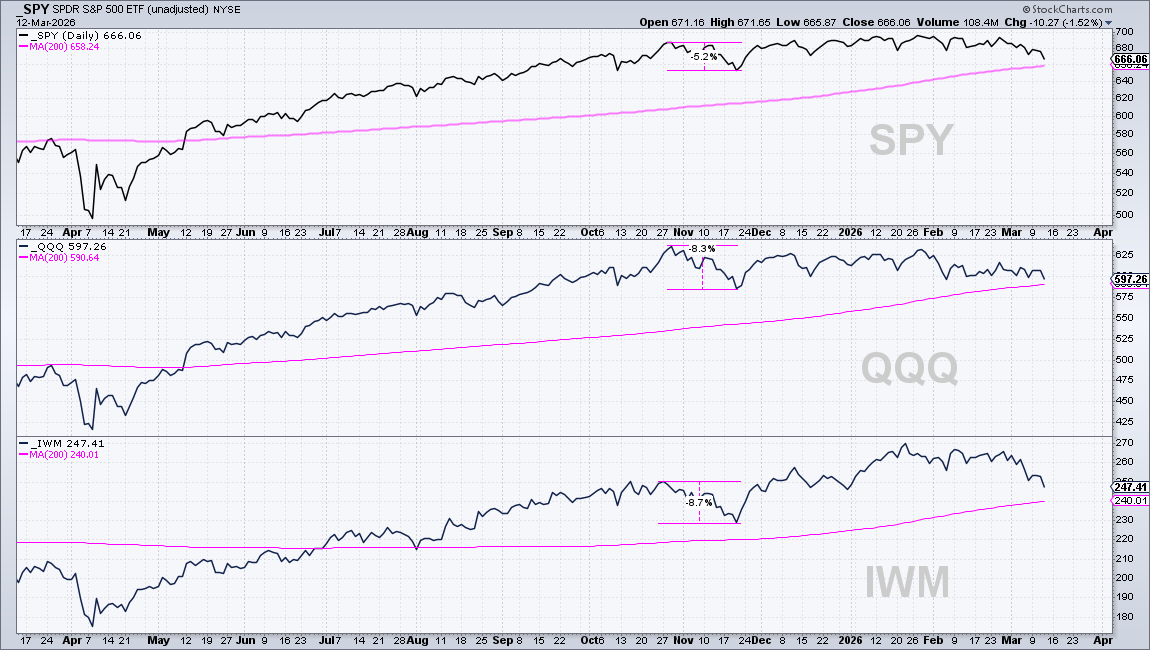
All three ETFs are still above their 200‑day simple moving averages (SMAs). That line shows the long‑term trend. When the price is above the line, the trend is considered bullish.
200‑Day Moving Average Still Shows an Uptrend
The 200‑day SMA is the most watched long‑term indicator for U.S. stocks. If SPY is above this line, the market is in an uptrend; below it, the market is in a downtrend.
To smooth out daily noise, we also look at a 5‑day SMA. When the 5‑day line crosses above the 200‑day line, it signals a bullish turn. When it crosses below, it signals a bearish turn.
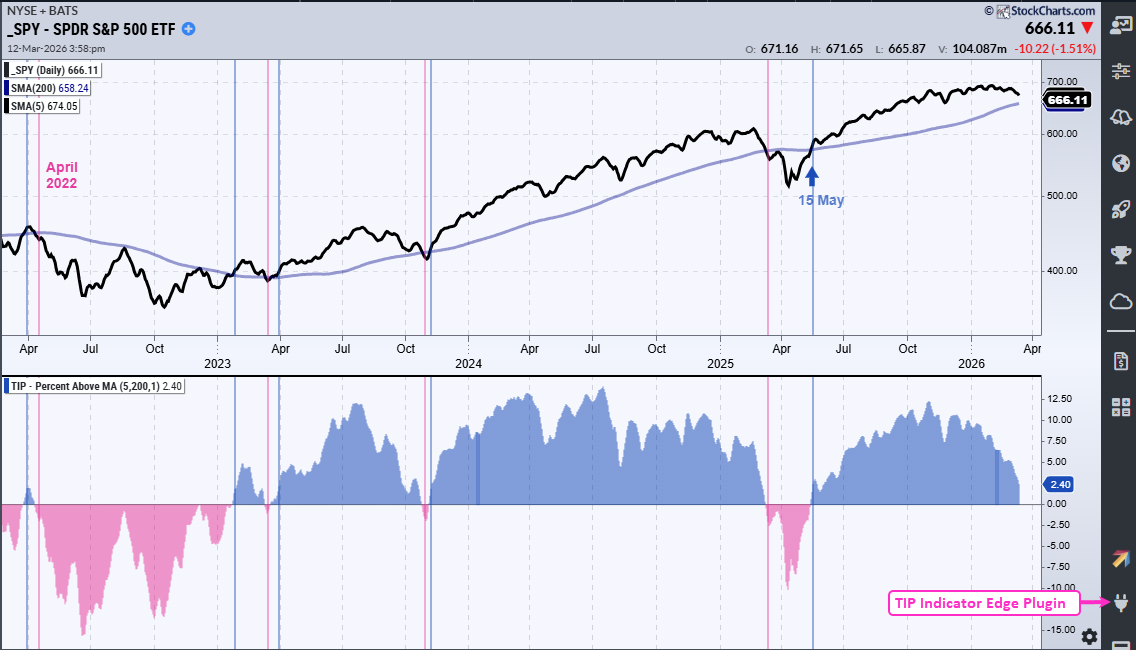
Right now the 5‑day SMA sits about 2.4 % above the 200‑day SMA, so the long‑term trend for SPY is still upward. The signal would turn negative only if the short‑term line falls below the long‑term line.
Base Metals ETF Keeps Rising
Even though SPY looks healthy, the overall economy is uncertain. Interest rates are higher, energy costs are up, and geopolitical risks remain. That’s why many investors look beyond stocks for safety.
The DB Base Metals ETF (DBB) has been climbing since the recent Middle‑East conflict began. The chart shows a solid long‑term uptrend that started with a breakout in September and continued into January.
Inside the recent consolidation, two short‑term patterns appear:
- A small wedge formed in February that broke to the upside, suggesting more upside could follow.
- The %B indicator dipped close to the oversold zone, hinting that buying pressure may return.
If the price breaks out of the current range, the next move could be higher, offering a good way to diversify away from pure equity risk.
Source: Materials provided by https://articles.stockcharts.com.Note: Content may be edited for style and length.