
Weekly Sector Rotation Review: Energy Leads, Utilities Climb
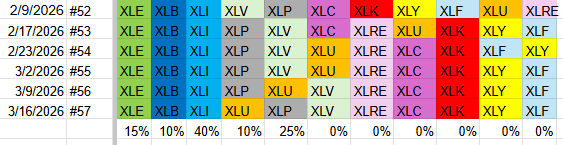
Last week the S&P 500 slipped a little. That caused a tiny change in the ranking of the top sectors. No new sectors entered the list, and none left. Only Utilities and Consumer Staples swapped places.
- Energy – XLE (15%)
- Materials – XLB (10%)
- Industrials – XLI (40%)
- Utilities – XLU (10%)
- Consumer Staples – XLP (25%)
- Health Care – XLV
- Real Estate – XLRE
- Communication Services – XLC
- Technology – XLK
- Consumer Discretionary – XLY
- Financials – XLF
Weekly Relative Rotation Graph
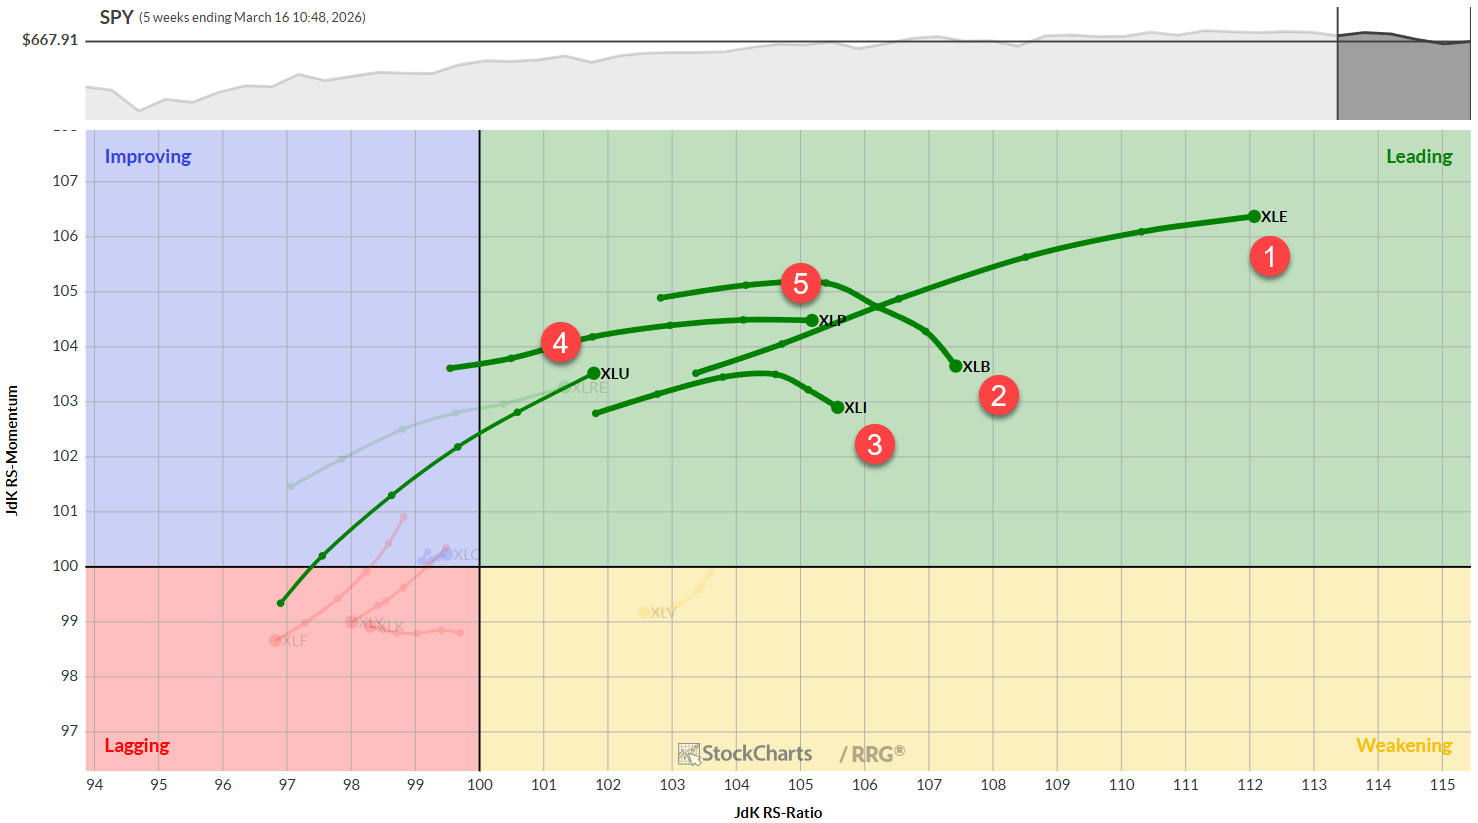
The weekly RRG shows all five leading sectors sitting in the “leading” quadrant. Energy is still the strongest and is moving deeper into that quadrant. Materials and Industrials stay strong, but their momentum is slowing a bit. Utilities just entered the leading quadrant and are pointing upward. Consumer Staples sit comfortably inside the leading quadrant with steady momentum.
Daily Relative Rotation Graph
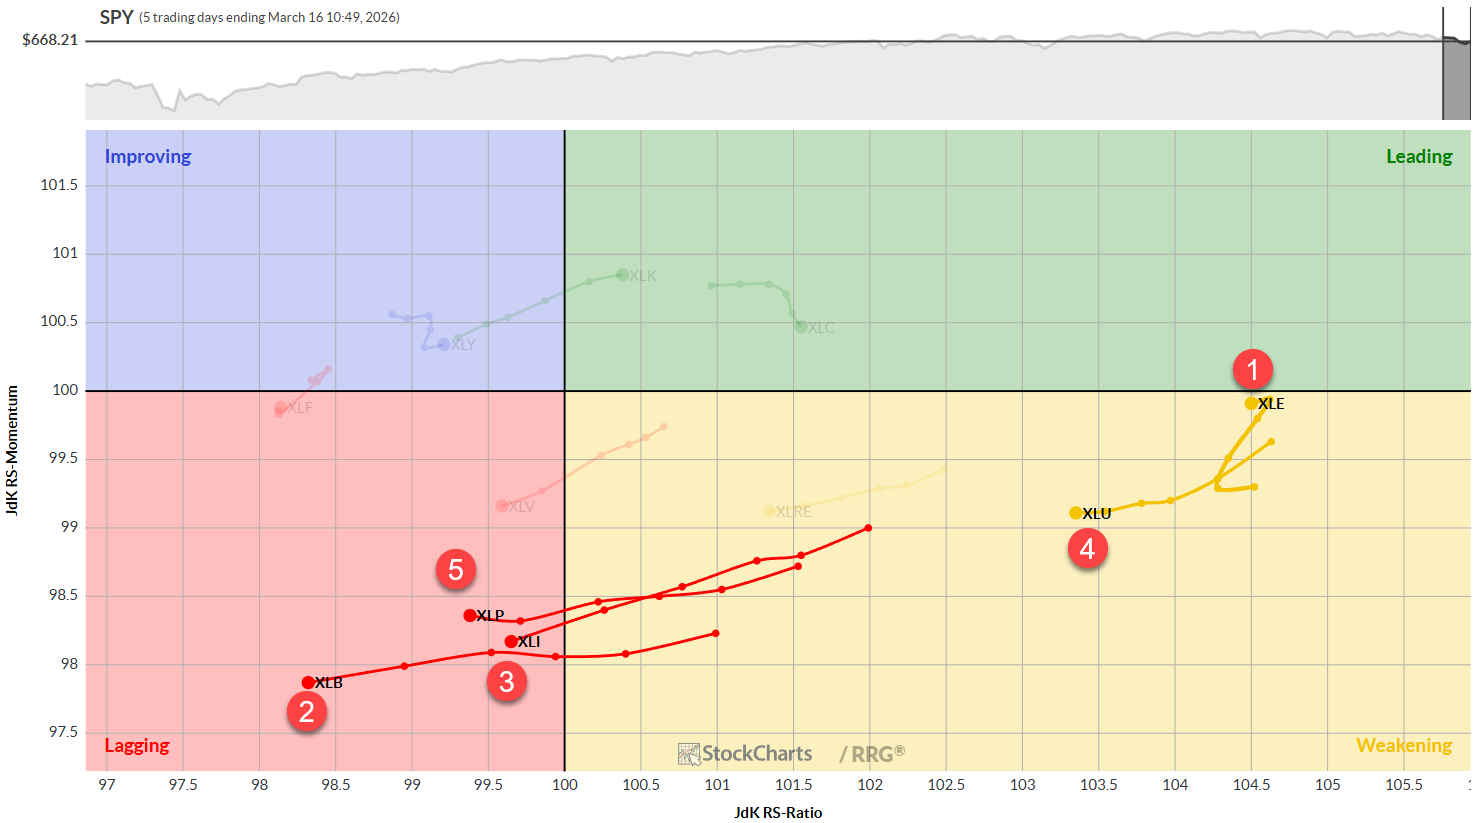
On the daily chart, Energy still has the highest relative‑strength score and is close to moving into the leading quadrant. Materials, Industrials, and Consumer Staples have slipped into the lagging quadrant for now, but they stay in the leading quadrant on the weekly view, suggesting the daily dip may be short‑lived. Utilities sit in the weakening quadrant but have room to climb back into the leading area.
Sector Highlights
Energy
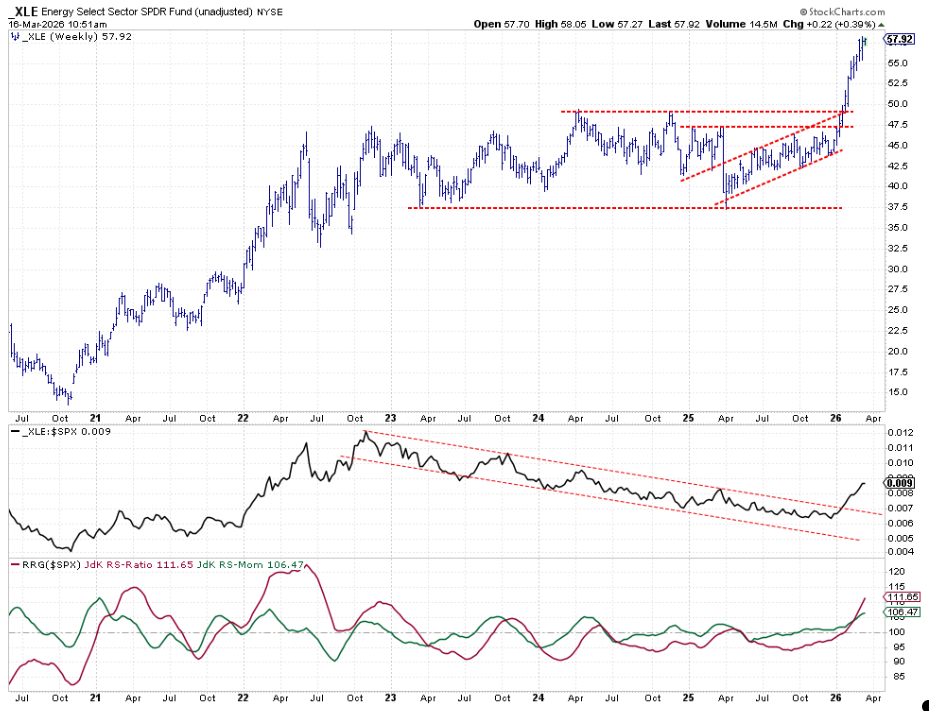
Energy broke above a flat resistance level and has stayed strong for the past few weeks. Both the raw relative‑strength line and the RRG lines are moving higher, confirming the sector’s strength.
Materials
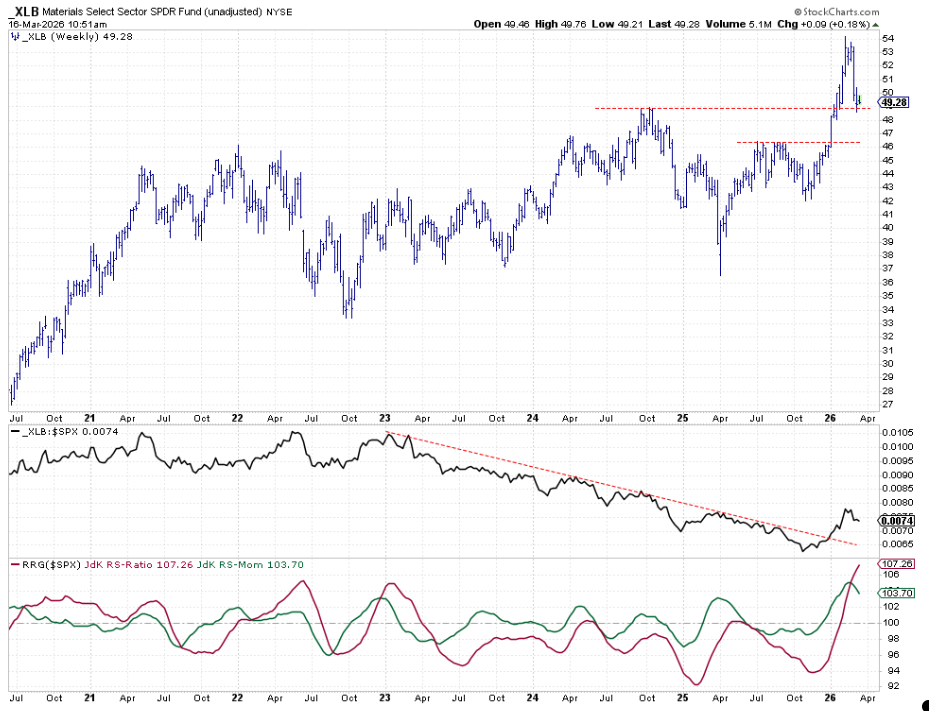
Materials tested an old resistance level that is now acting as support. The raw RS line broke out of a falling channel and is forming a small new high. Momentum has slowed a bit, but the RS‑ratio is at its highest point in five years, indicating a solid rebound.
Industrials
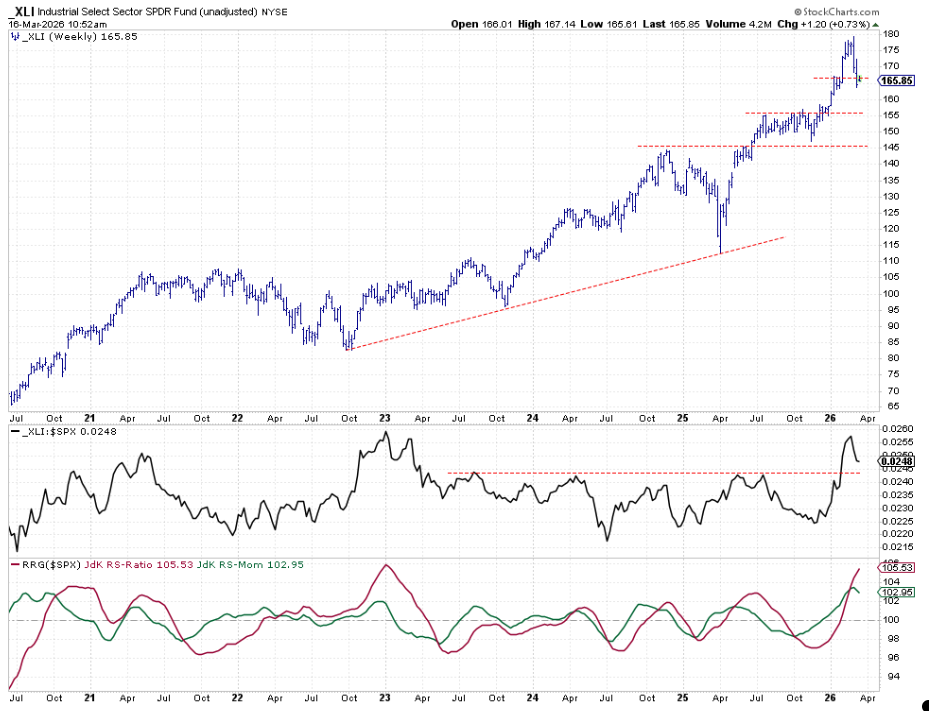
Industrials are near a support level that was set at the start of the year. After two weeks of sharp drops, the sector is starting to stabilize. The raw RS line is heading toward its first support level, while the RS‑ratio remains high, suggesting a brief pull‑back before the next move.
Utilities
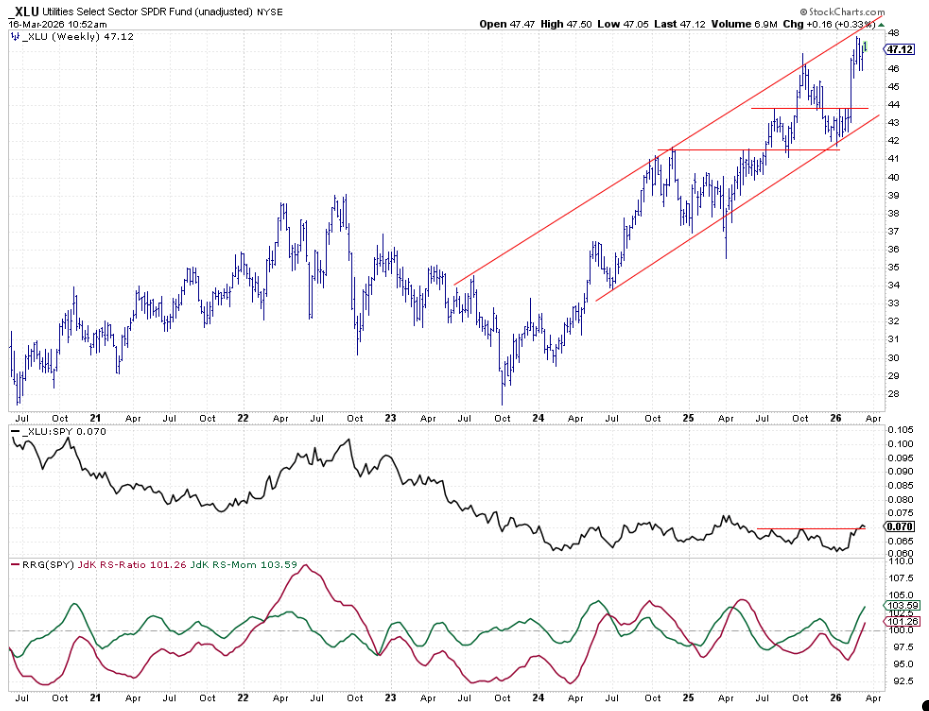
Utilities moved up to the fourth spot and are holding steady around the 47 level on the price chart. The raw RS line looks ready to break its overhead resistance, which could keep the RRG lines pointing upward.
Consumer Staples
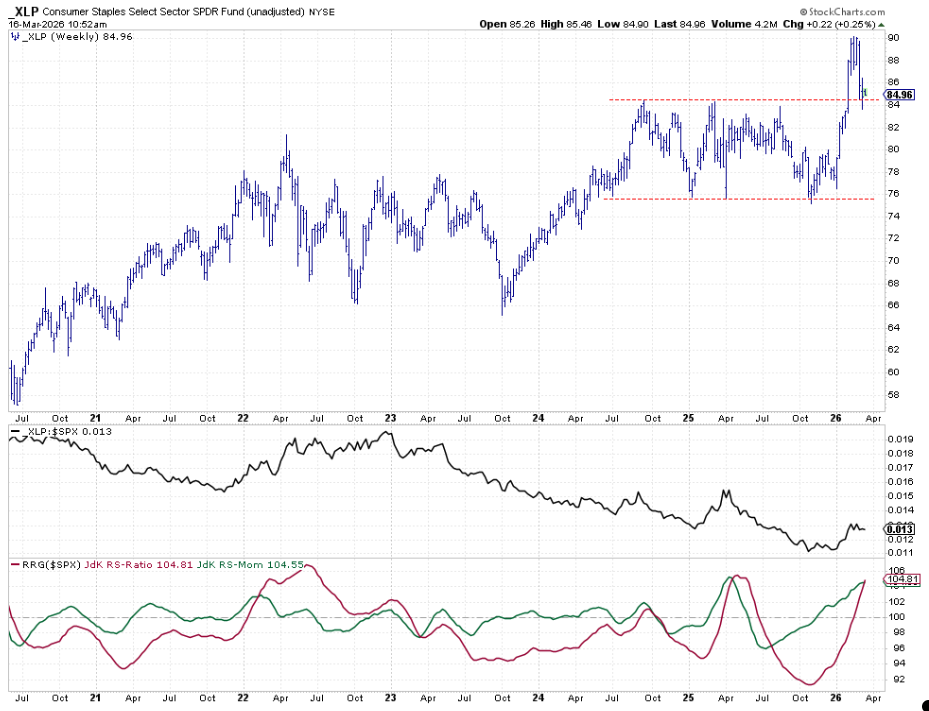
Consumer Staples fell back toward a breakout level near 84, which is acting as support. If the sector holds there, it could start a new rally. Both RRG lines are well above 100 and continue to rise.
Portfolio Performance
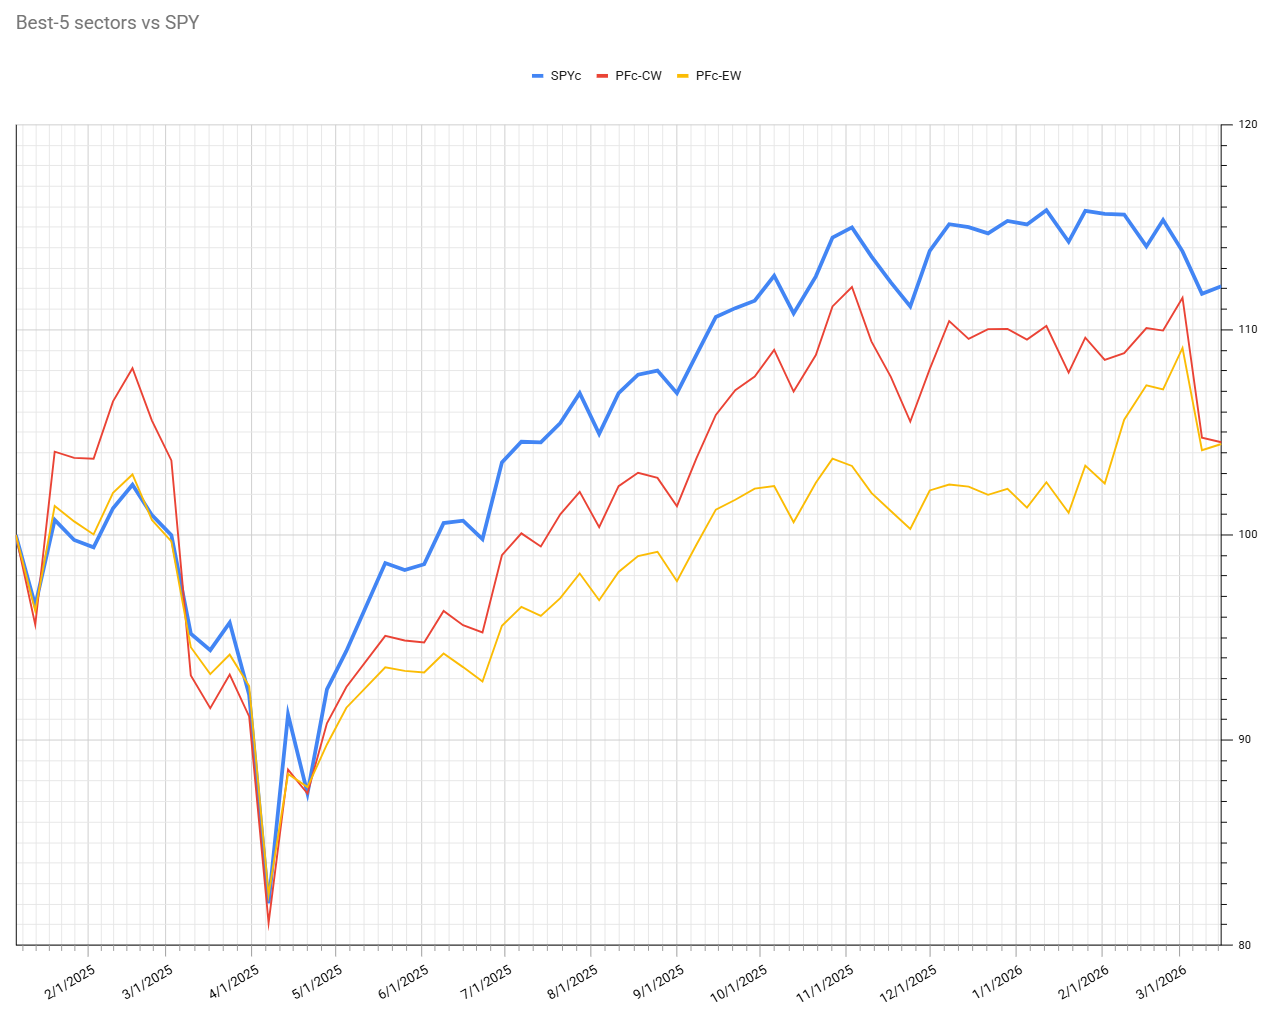
The gap between the two test portfolios widened again last week. Both the cap‑weighted and equal‑weighted portfolios are still about six to seven points below the S&P 500. We will watch to see if the defensive mix of the top five sectors can help them catch up.
Source: Materials provided by https://articles.stockcharts.com.Note: Content may be edited for style and length.