

The economy is getting tougher. Oil costs stay high, and interest rates keep going up. The big S&P 500 fund (SPY) just fell below its 200‑day average. This article looks at how today’s oil and rate spikes compare to the shock we saw in 2022.
SPY and QQQ Lose Ground
Mid‑size and small‑cap stocks are doing a little better than the biggest companies. The equal‑weight S&P 500 fund (RSP) and the Russell 2000 fund (IWM) are still above their 200‑day lines, but only by a tiny amount. In contrast, SPY and the Nasdaq‑100 fund (QQQ) slipped below theirs this month.
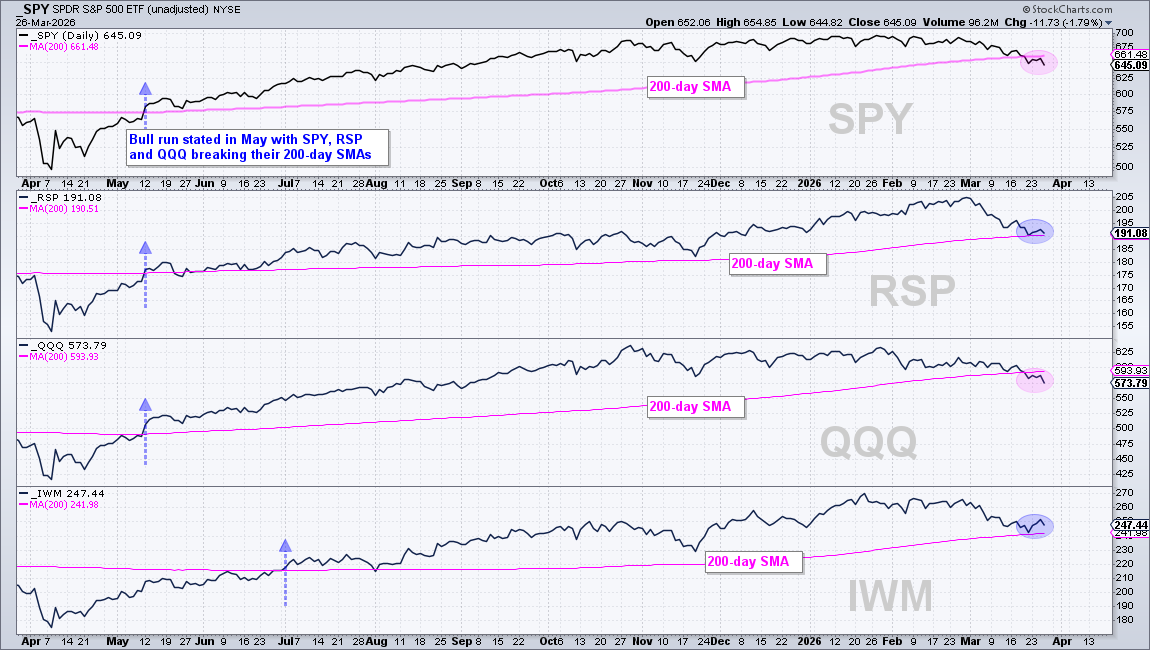
The break in SPY and QQQ matters more than the slight strength in RSP and IWM. When the big ETFs are under their key moving average, it’s hard to feel confident about stocks. RSP is right at its 200‑day line, so another dip could push it below the line too. Back in May, the market turned up when SPY, RSP and QQQ all broke above their 200‑day averages. Right now we see the opposite.
High‑Low Line Shows Weakening Momentum
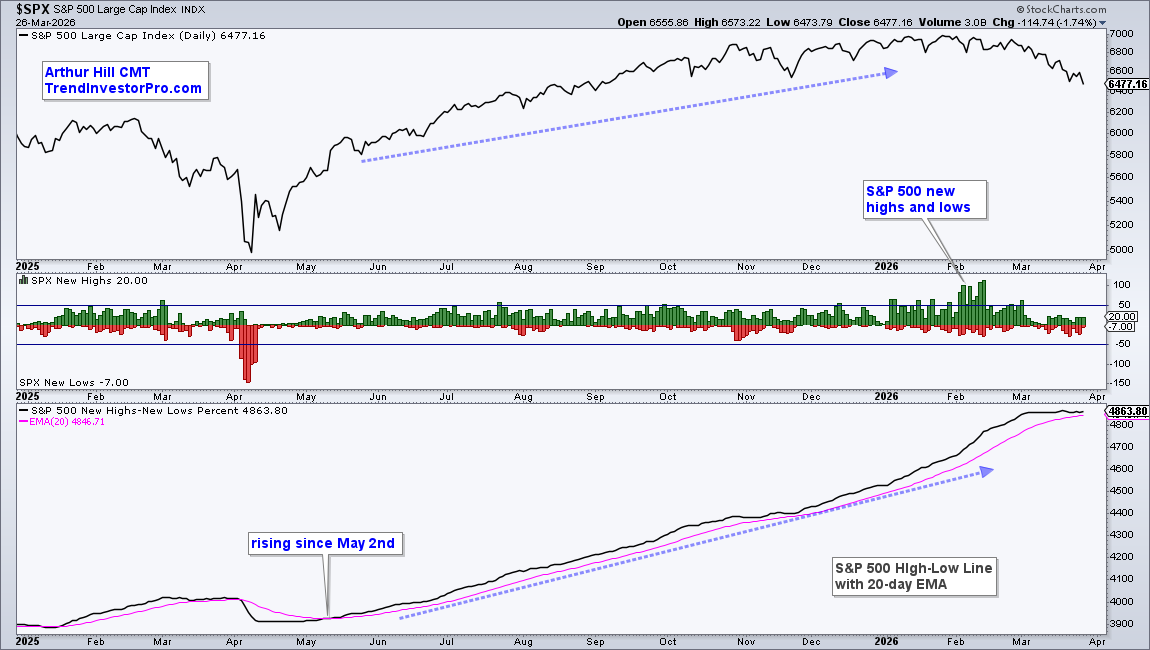
The S&P 500’s High‑Low Line measures how many new highs appear compared to new lows. As long as the line stays above its 20‑day average, the market is still making more highs than lows. The line flattened in March, which signals that the pace of new highs is slowing. If the line falls below the 20‑day average, it would mean more lows are forming and the market could turn down.
Comparing Today’s Oil Spike to 2022
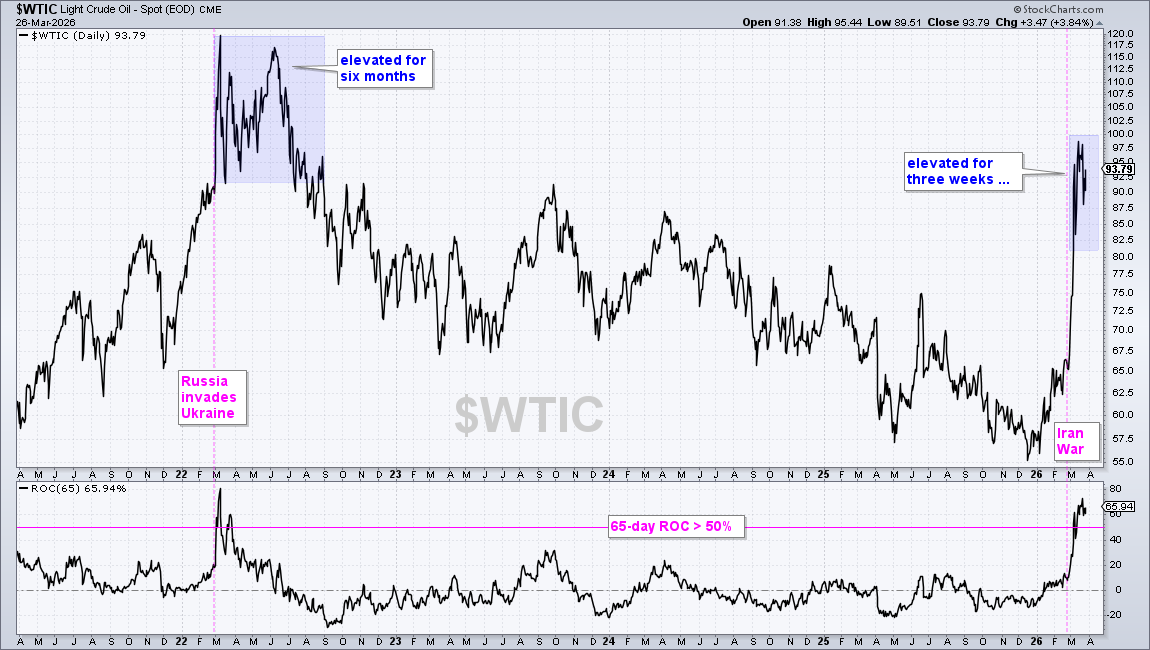
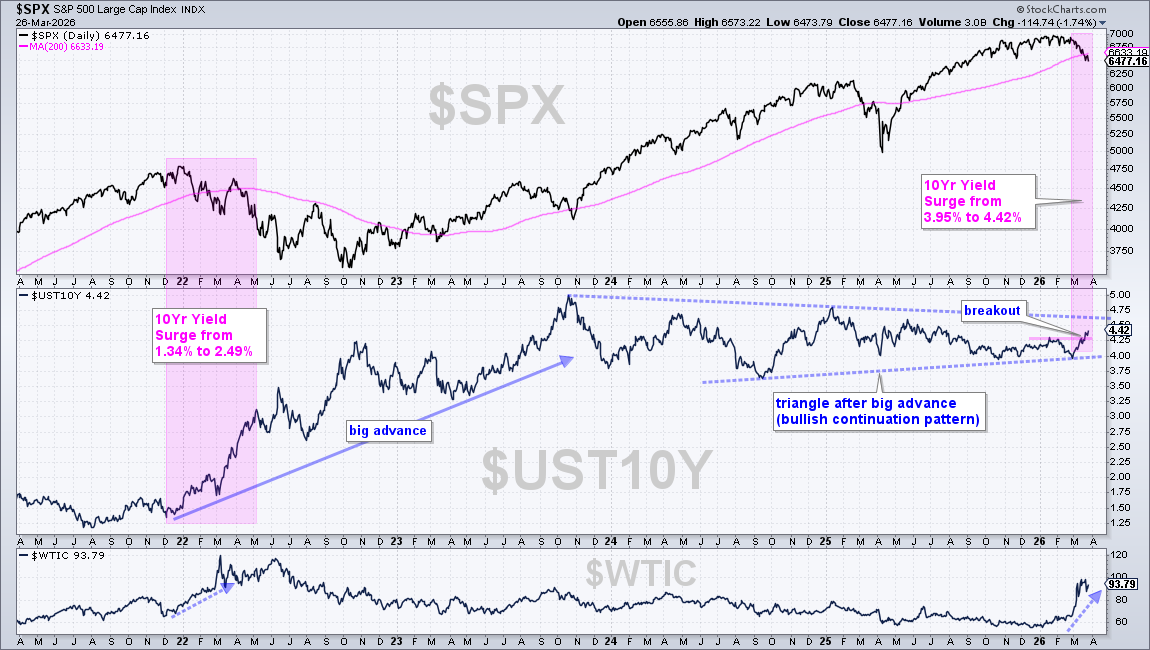
Oil prices have jumped more than 50% in just 65 days, just like they did in early 2022. Back then, oil stayed high for about six months and helped push the market into a bear phase. Today the price is above $90 and has stayed high for three weeks. The longer oil stays pricey, the tougher it gets for stocks and bonds.
Oil’s Effect on the S&P 500
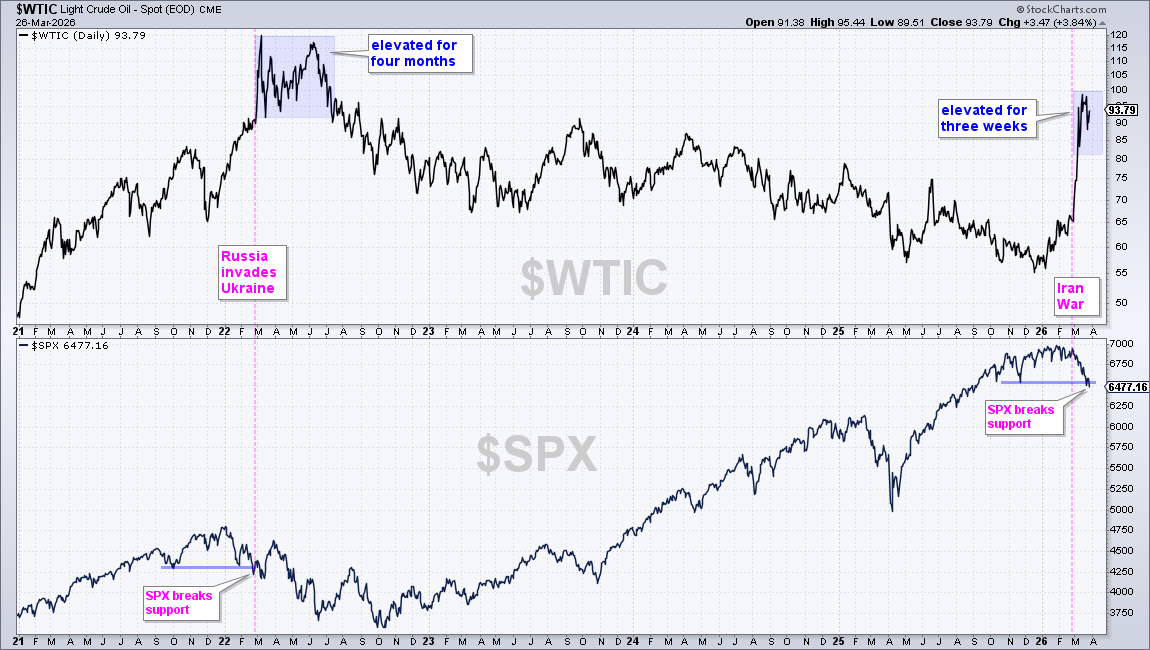
When oil jumped in 2022, the S&P 500 fell below an important support level and kept sliding until October. The chart below shows a similar pattern forming this year – the index slipped below a key low in November after oil spiked.
Rising Yields Add Pressure
In 2022, the 10‑year Treasury yield jumped from about 1.3% to 2.5% as oil prices climbed. The mix of high oil and high rates helped drive the market down. Today the 10‑year yield has broken past 4.4% and is forming a large triangle pattern. If the price breaks out upward, we could see yields move above 5%.
Overall, the market shows mixed signals. Some breadth indicators are still neutral, but a few are getting close to warning levels. We will keep watching these trends.
Source: Materials provided by https://articles.stockcharts.com.Note: Content may be edited for style and length.