


Quick question: Which sector ETF has performed best this March?
You might think Energy because oil prices have surged. Actually, Information Technology (XLK) is the only sector that is up, even though we are only a third of the way through the first quarter.
Only three sector funds beat the S&P 500 ETF (SPY) so far: XLK, Communication Services (XLC), and Energy (XLE).

The spotlight now turns to NVIDIA (NVDA). The company will host its annual GTC AI Conference from March 16‑19 in San Jose, California. The highlight will be CEO Jensen Huang’s keynote on Monday afternoon. He may talk about AI factories, digital twins, sovereign AI, and the five‑layer AI model.
Watching the Price
Traders should listen to the talk and watch the stock’s moves. NVDA is barely staying above its 200‑day moving average – a level it hasn’t crossed in ten months. If the stock falls below that line, a bearish “death cross” could appear as the quarter ends.
So far, bulls have kept NVDA above the $170 area. The $164‑$175 range looks like support, and a line near $174 may act as an uptrend support. A break below could hurt the AI trade.
Remember the post‑earnings jump to $203 on February 25? The rally looked strong, but NVDA dropped 15% in a few sessions, ending near $173.

Why the AI Trade Matters
NVDA’s GTC is a second chance for bulls to show strength. The S&P 500 is still near a rounded‑top pattern and could slip if NVDA falters. The index is only 3% below its record high and sits just above the 200‑day line.
A weak performance at the conference could break the quiet stretch the market has had since last October.
Volatility Clues
NVDA’s average true range (ATR) over the last 14 sessions is about 3.4%, or $6.30 per share. Implied volatility is near 40%, and the next earnings report isn’t due until late May.
New Tech Leaders
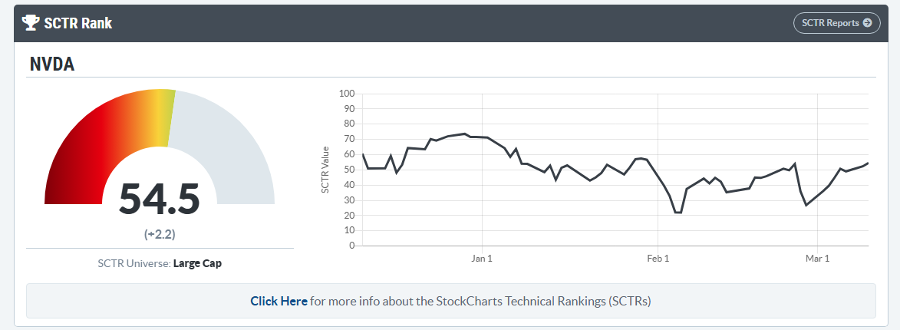
NVDA’s Technical Rank (SCTR) is a modest 54.5, down from the market‑leading levels earlier this year. Other tech names like SanDisk (SNDK), Micron (MU), and Western Digital (WDC) now show more strength.
Information Technology still tops the SCTR list, with a few materials and industrial firms near the top. Biotech also appears, with the SPDR S&P Biotech ETF (XBI) close to a 52‑week high.

Bearish Perspective
Bearish traders see an opening as March Madness unfolds. The OptionsPlay Score places NVDA in a Bearish Trend Following scan, suggesting long puts could be attractive for the next month.
Waiting for a Break
My view: Wait until NVDA closes below $170 before getting too bearish. A break under the $174 support line could start a head‑and‑shoulders pattern, targeting $130‑$135.
If that happens, the S&P 500 would likely struggle to break higher, possibly leading to a broader correction.

Bottom Line
XLK is the top‑performing sector this March, but a rally to new S&P 500 highs is not guaranteed. The market’s direction may hinge on Jensen Huang’s keynote at NVIDIA’s GTC AI conference. I’m watching NVDA’s price action and the $170‑$175 support zone closely.
Disclaimer: This content is for educational purposes only and does not constitute financial advice.
Source: Materials provided by https://articles.stockcharts.com.Note: Content may be edited for style and length.