
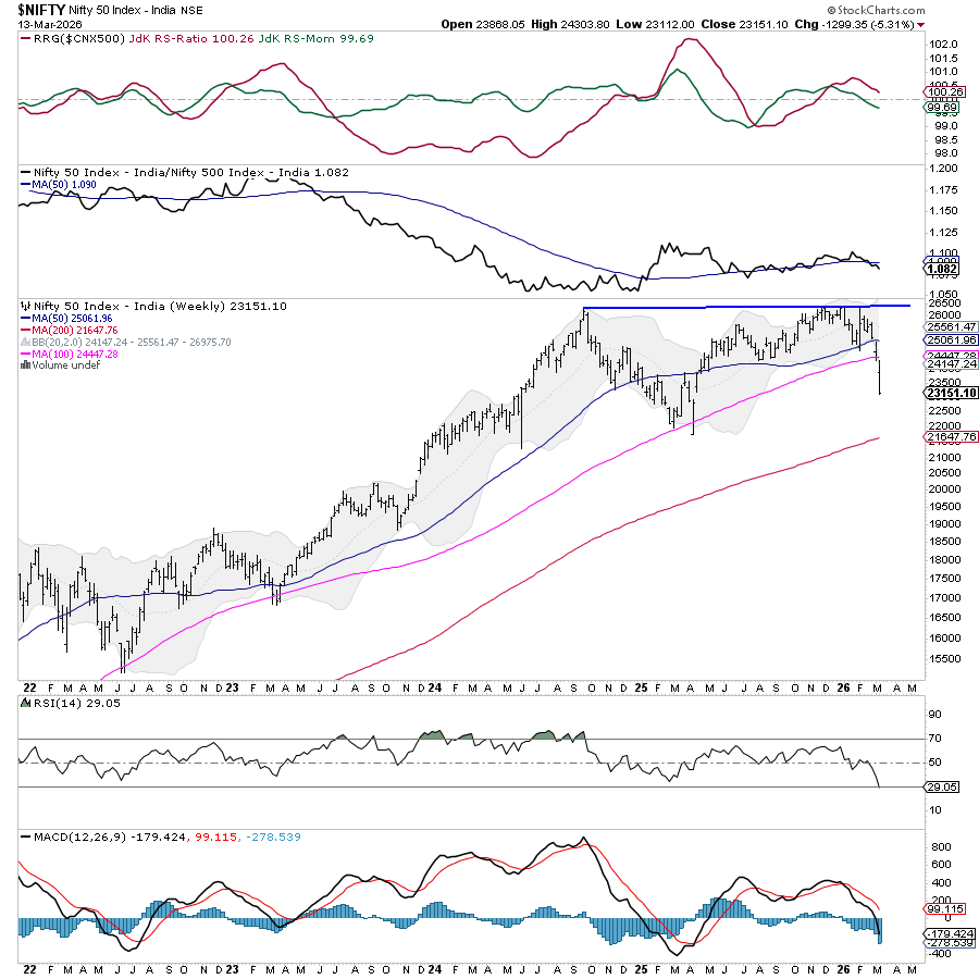
The market dropped sharply this week and finished well below the starting level. After a brief pause early on, sellers kept pushing the Nifty down. The index moved through a range of about 1,192 points, swinging between 24,304 and 23,112. Fear grew, and the India VIX jumped another 14% after a 45% rise the week before. By Friday the Nifty was down 1,299 points, or 5.3%.
Technically, the market is now in a weak spot. The Nifty fell through its 100‑week moving average at 24,448, which had been a strong support line. Losing that level changes the medium‑term outlook to the downside unless the index climbs back above it quickly. With volatility high and global tensions still tense, any bounce will likely meet resistance around the 24,400‑24,500 zone, the same area where the moving average broke. A clear move above this zone is needed to calm sentiment; otherwise, the market may keep correcting.
Looking ahead, traders may start the week on a careful note as they watch global news and the high volatility. Immediate resistance sits near 23,500 and 23,750, while support levels sit at 23,000 and 22,710.
The weekly RSI is at 29, deep in oversold territory, and it has made a new low for the last 14 periods. Although the RSI is neutral compared with price, the low reading hints that short‑term pullbacks could happen. The weekly MACD stays below its signal line and remains negative, showing continued bearish momentum. A large red candle also formed, confirming strong selling pressure.
On the chart, the Nifty broke out of a broad consolidation that had formed near recent highs. It also failed to stay above the 50‑week and 100‑week moving averages and closed below the lower Bollinger band. A brief bounce inside the band is possible, but the overall technical picture stays weak.
Because volatility is high and key supports have been broken, a defensive stance is advisable. Avoid aggressive buying until the index shows stability above the broken 100‑week average. Focus on protecting existing profits, using tight stops, and picking individual stocks rather than making big index bets. Until the market calms, careful risk management and selective participation are the best approaches for the week.
Sector Outlook for the Next Week
We compared many sectors against the broader market using Relative Rotation Graphs (RRG). The Energy, Financial Services, PSE, Pharma, Nifty Bank, PSU Bank, Infrastructure, and Metal groups sit in the leading quadrant, meaning they could still beat the market. However, all of them except Pharma, PSE, and Energy are losing relative momentum.
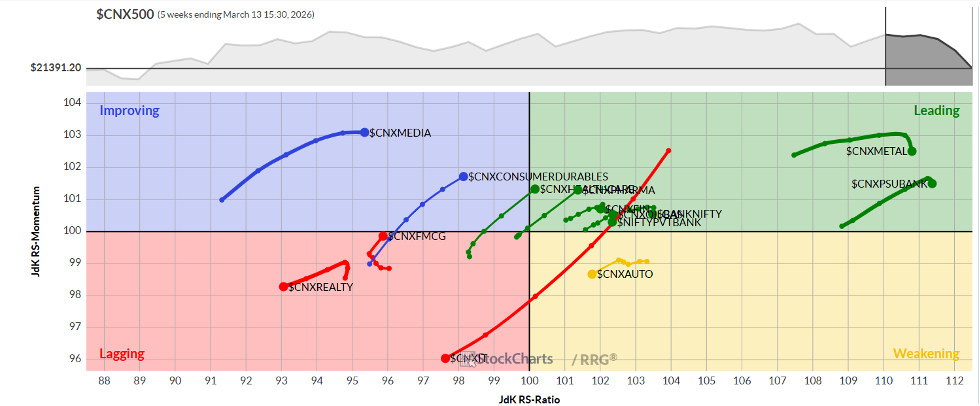
The Services, Mid‑Cap 100, and Auto sectors are in the weakening quadrant. They might have a few bright spots, but overall they could lag behind.
The IT and Realty sectors remain in the lagging quadrant, suggesting they may underperform. The FMCG sector is also lagging but is starting to pick up speed against the broader market.
The Media sector is the only one in the improving quadrant, showing strong relative momentum and could continue to outperform.
Note: RRG charts show how groups of stocks perform relative to the broader market. They are not direct buy or sell signals.
Source: Materials provided by https://articles.stockcharts.com.Note: Content may be edited for style and length.