

If the market feels confusing right now, you are not alone. Many investors are wondering why the usual patterns seem to have flipped.
Recent news said the International Energy Agency would release oil reserves, which normally pushes oil prices down. Instead, oil went up while stocks, bonds, and precious metals fell and the U.S. dollar got stronger.
When politics stir things up, the charts often tell the clearest story. Let’s look at what the numbers are saying.
Stocks Are Tilting Lower
Even with all the headlines, the big equity market hasn’t changed its shape much. The S&P 500 is still moving inside the range it has been stuck in since October. The Nasdaq is making lower highs and lower lows, which means the overall direction is still down.
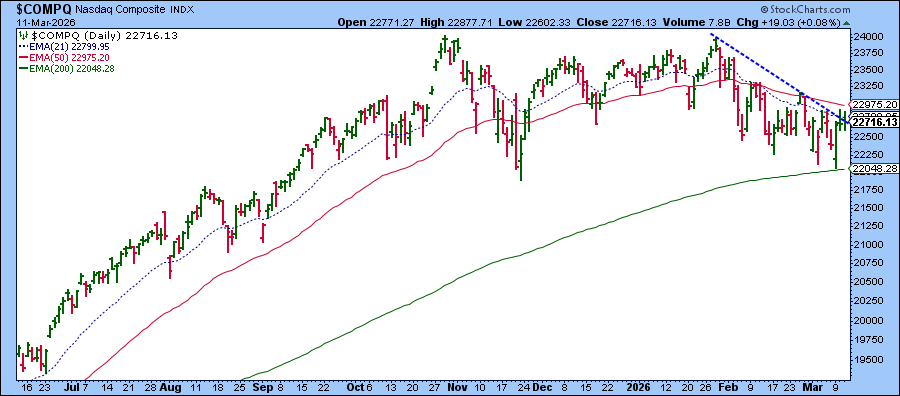
The Nasdaq recently bounced off its 200‑day exponential moving average (EMA), a small sign of hope. Because price moves have been choppy, I use the 21‑day and 50‑day EMAs to see the bigger picture.
Right now the short‑term EMA is still below the longer‑term EMA, and the index has tried twice to push above the sloping trendline. Both times it fell back, closing at or below the line.
The Dow Jones shows a similar pattern. Overall, the market leans a little down, but buying pressure can cause quick spikes upward on good days.
Semiconductors Lead the Pack
Technology stocks, especially semiconductors, are worth a close look. In a recent industry ranking, semiconductors topped the list of U.S. sectors gaining strength.
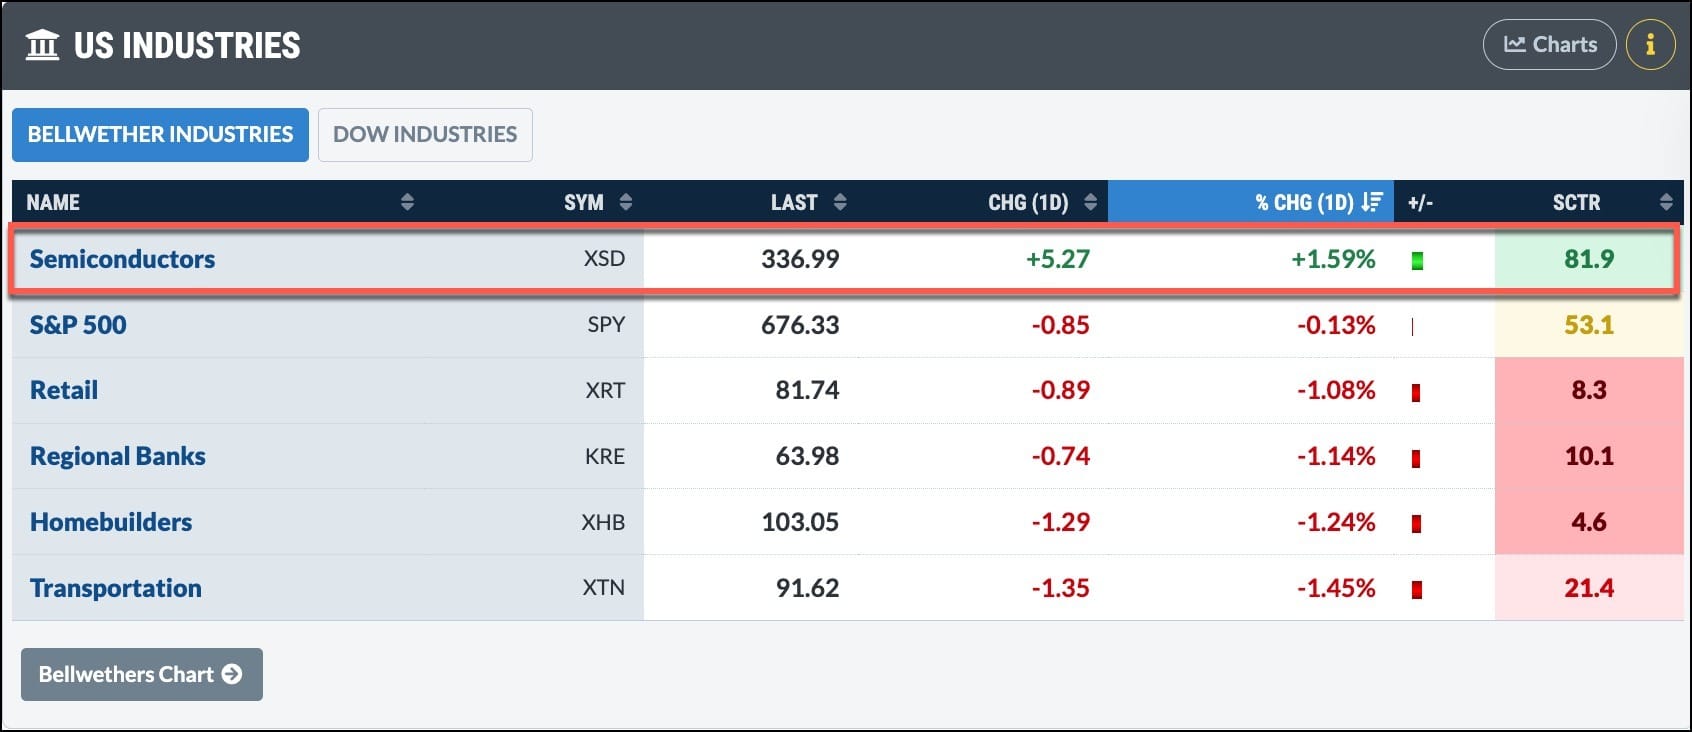
The SPDR Semiconductor ETF (XSD) has a technical rank above 80, showing it’s beating most other sectors. XSD bounced off its 200‑day EMA with a strong move, but the 21‑day EMA is still touching the 50‑day EMA, and the ETF is forming lower highs and lower lows. A clear break of that pattern would be needed before we talk about a real reversal.
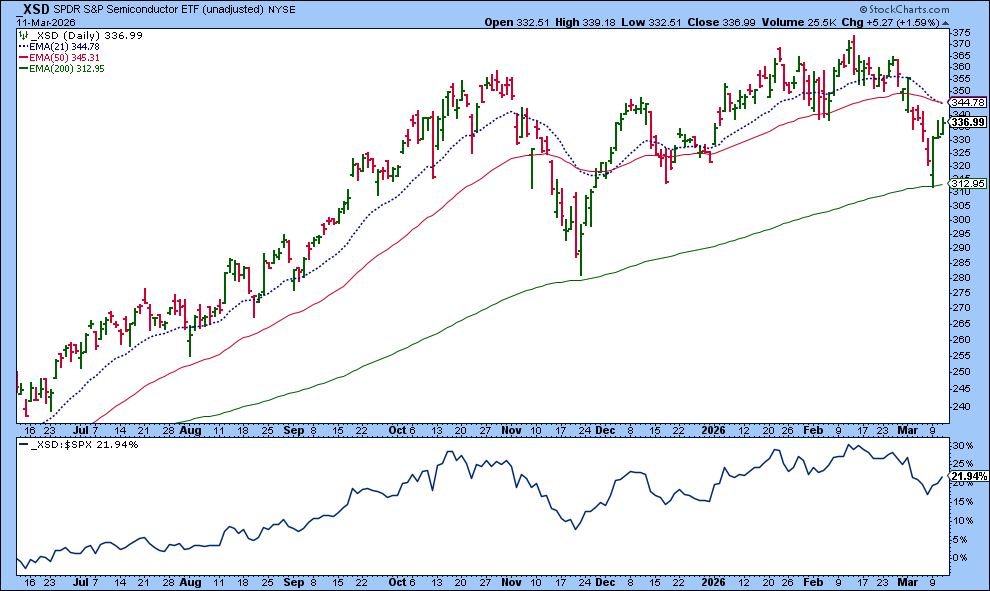
It’s a good sign that XSD is outperforming the broader S&P 500. If the overall market turns up, semiconductor strength could help lift everything else.
Momentum Clue: Micron (MU)
One simple tool to see momentum is the Rate of Change (ROC) indicator. The biggest holding in XSD is Micron Technology (MU). MU has been on a steady rise since April 2025, but it is now in a consolidation phase.
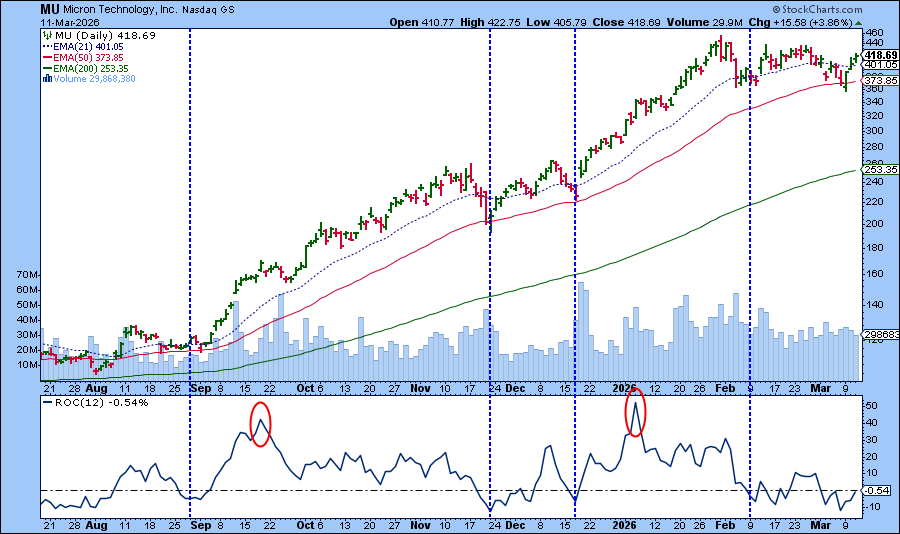
When MU pulled back to its 50‑day simple moving average, the ROC dipped below zero, marking a brief pause. Two clear surges happened: one in mid‑September 2025 and another in early January 2026. After each surge, the price kept climbing, while the ROC stayed just above zero, signaling the uptrend was still alive.
Recently the ROC has been hovering around the zero line, moving a little above or below it as the price bounces near the 21‑day EMA. This wobble suggests the trend is still undecided.
Bottom Line
With ongoing tension in the Middle East, it may be wise to avoid chasing new positions, even if prices look cheap. Instead, watch leading groups like semiconductors. When geopolitical pressure eases and stocks such as MU break higher with ROC turning solidly positive, it could be an early sign that the broader market is ready to rise.
Until then, protect your capital and stay patient.
Disclaimer: This article is for educational purposes only and does not constitute financial advice. Always consider your personal situation or consult a professional before acting.
Source: Materials provided by https://articles.stockcharts.com.Note: Content may be edited for style and length.