

Before we start…
You see two stocks that look promising. Both are moving. Which one should you trade? Many people pick a stock because it’s popular or because they like the brand. That is not a reliable way to decide.
Instead, first find out which stock is leading and which one is lagging. Then compare each to the S&P 500. After that, look at momentum and money flow before you study the price chart. I will show you how to do all of this.
Follow this simple workflow and you won’t get stuck at the decision fork.
Step 1 – Use a Performance Chart to See Who Is Ahead
Someone says to buy NVIDIA Corp. (NVDA). Another says Advanced Micro Devices (AMD) is gaining strength.
Let’s check how each performed over the past year and compare them to the S&P 500 using the SPDR S&P 500 ETF (SPY) as a proxy.
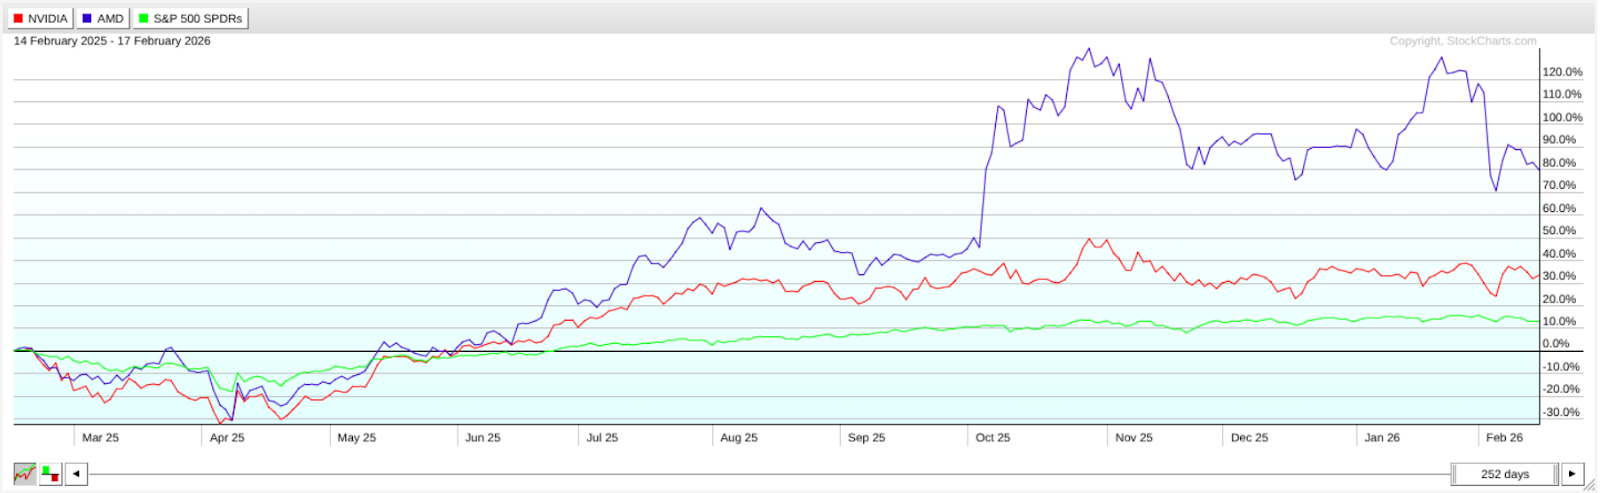
This chart removes emotion.
- AMD leads – up about 80%.
- NVDA trails – up only about 30%.
- Both beat the S&P 500, which is up just over 10%.
Remember, outperformance can change, but it tells us where the strength is right now.
Step 2 – Use Ratio Charts to Zoom In on Leadership
Set up three price‑performance ratios on an AMD chart:
- AMD vs. NVDA – shows if AMD beats NVDA.
- AMD vs. SPY – shows if AMD beats the market.
- NVDA vs. SPY – shows if NVDA beats the market.
A rising line means the first symbol is stronger; a falling line means it is weaker.
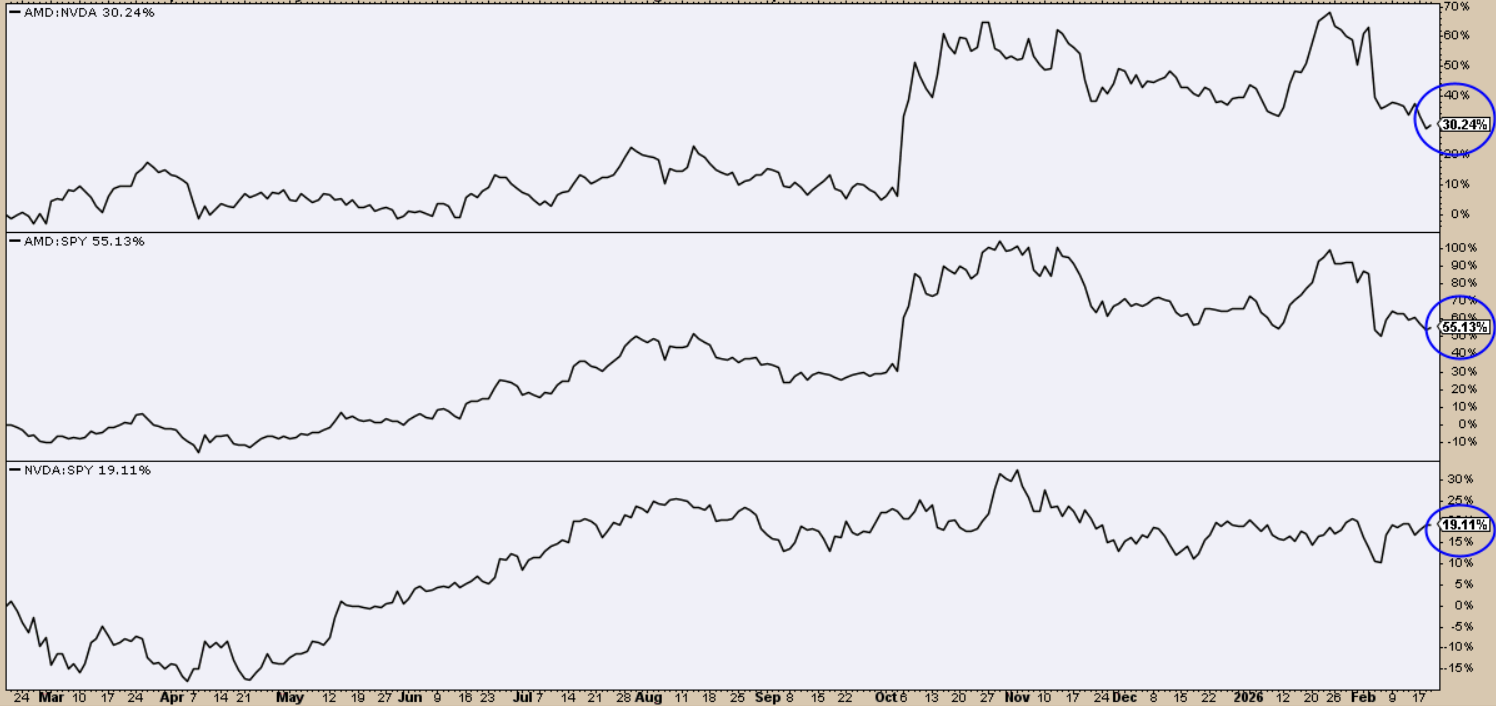
The ratios confirm what the performance chart showed: AMD is gaining on NVDA and the index, though its lead is starting to wobble. NVDA stays near the index level, moving sideways.
Now we must decide: buy the leader or wait for the underdog to catch up?
Step 3 – Check Momentum, Volume and Market Structure
Use this quick checklist:
- Is the Relative Strength Index (RSI) between 40 and 70 (bullish range)?
- Is buying pressure positive? (The Chaikin Money Flow, CMF, works well.)
- Is the price trending up, down, or flat?
AMD Review
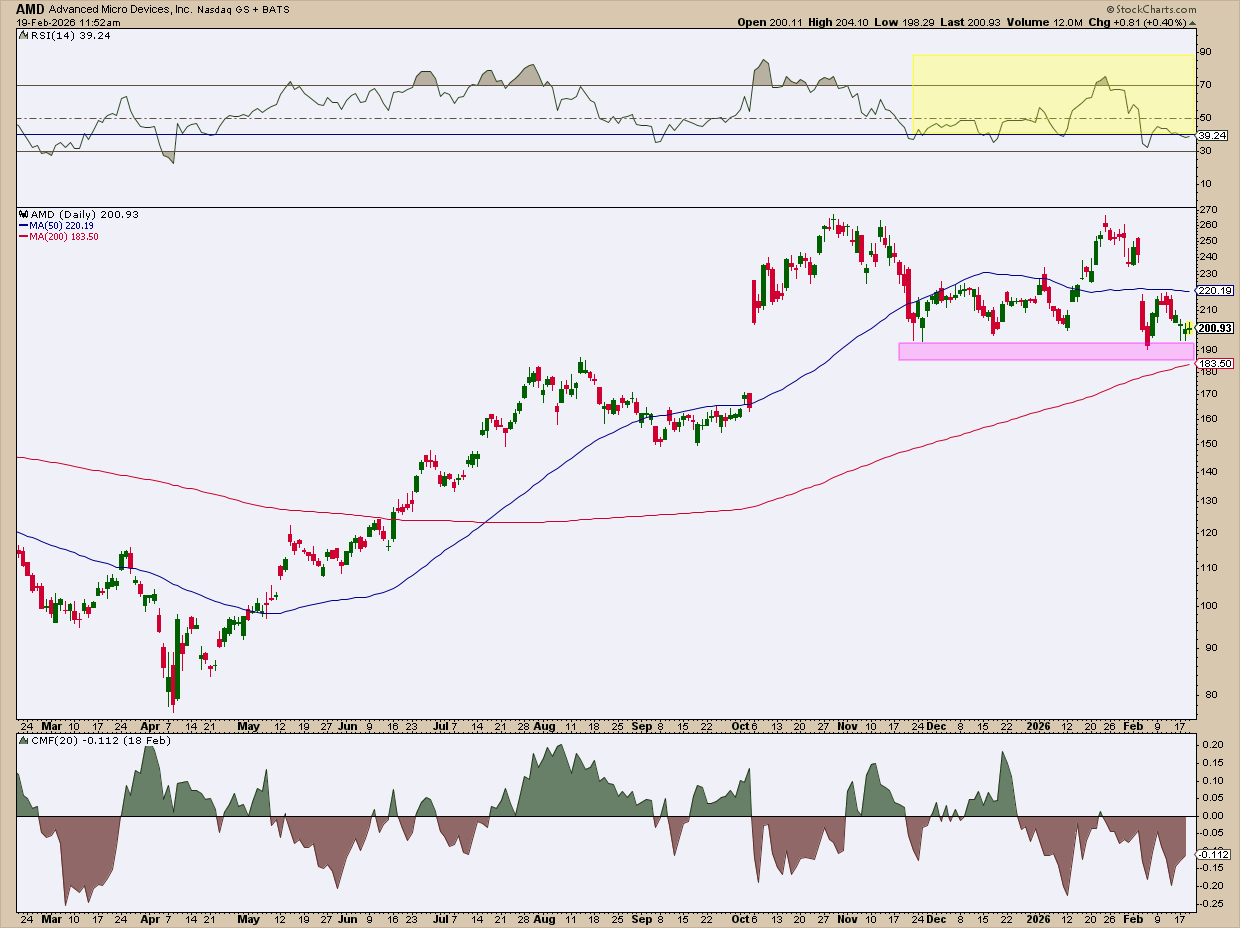
- RSI keeps falling below 40 – not bullish.
- CMF stays below zero – strong selling pressure.
- Price is near $190, just above the 200‑day average, but moves in a flat range.
Verdict: Wait and watch. No trade right now.
NVDA Review
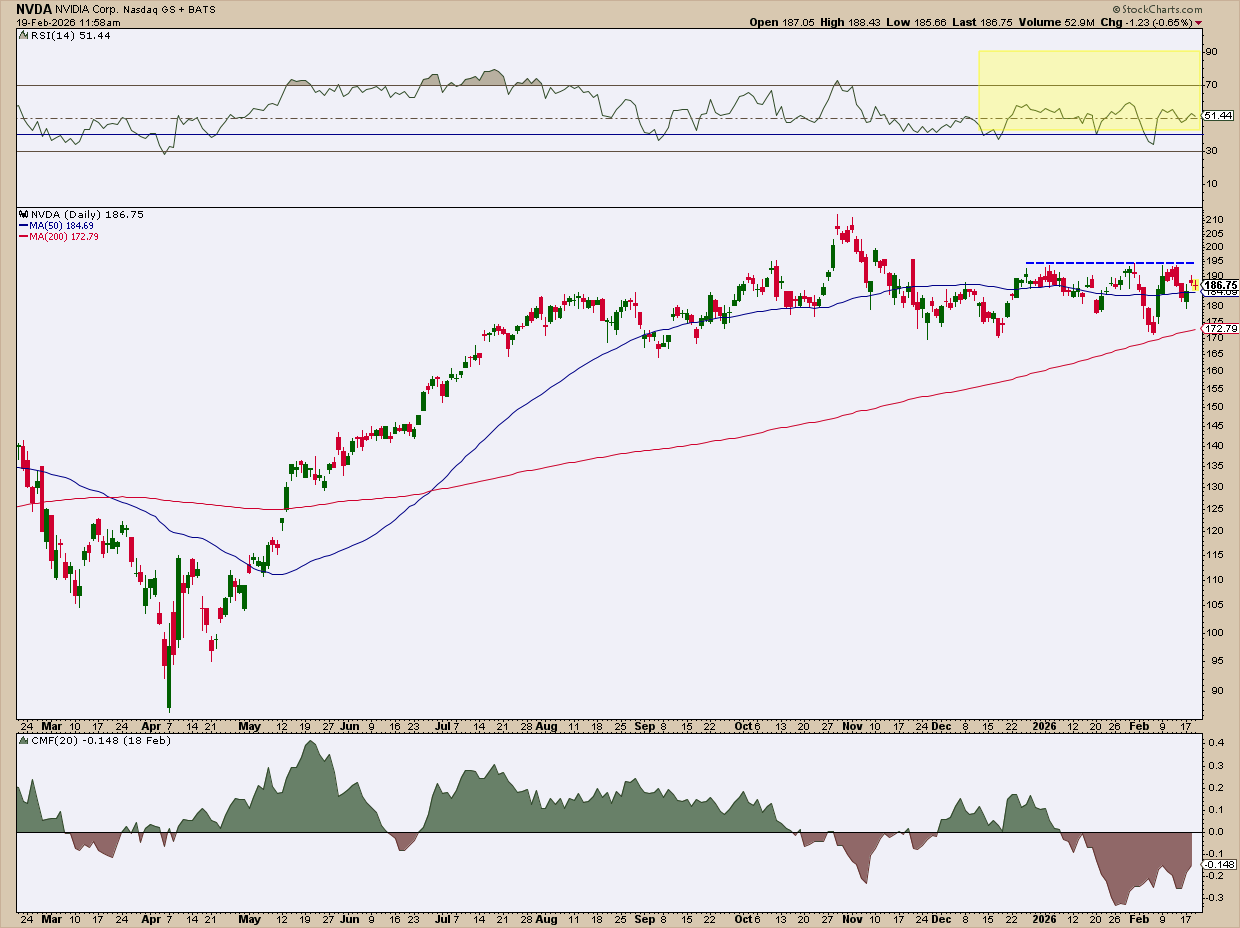
- RSI hovers around 40, occasionally dipping lower. A bullish reading would be above 50.
- CMF is deep in negative territory.
- Price trades in a narrow band with resistance near $195. A breakout could improve RSI and CMF.
Verdict: Also wait. No trade until the indicators turn positive.
Insider Tip – A Five‑Test Framework
- Performance Test: Which stock leads?
- Benchmark Test: Does it beat the S&P 500?
- Momentum Test: Is RSI in the bullish range?
- Volume Test: Is money flow positive?
- Structure Test: Is the price trending or flat? Where are support and resistance?
If a stock fails several tests, stay out. If it passes most, consider entering with a sensible stop loss.
What If Both Stocks Look Strong?
Choose the one with the stronger trend, higher SCTR score, or better growth outlook. You can also split your capital between the two to lower risk – that’s called diversification.
Final Thoughts
When you need to pick between two stocks, follow a repeatable process. Compare performance, ratios, momentum, volume and market structure. The story behind the stock matters less than the numbers.
Source: Materials provided by https://articles.stockcharts.com.Note: Content may be edited for style and length.