
Gold Panic Clears Path for Newmont Bounce Trade

Gold was one of the hottest topics last year. When the war in Iran started, gold stopped being a safe‑haven. Many investors were already piled into the trade.
The war also caused an energy shock. Oil prices jumped, inflation worries rose again, and markets stopped expecting big rate cuts. That made gold harder to hold in the short term. Higher yields, a stronger dollar, and forced selling started to matter more.
The gold bubble is now deflating, and miners like Newmont (ticker NEM) feel the pressure. This is where a trader can find a chance. It is not a fresh breakout in precious metals; it is a counter‑trend setup caused by panic selling.
What the Chart Shows
Newmont had a long‑term uptrend, but it fell sharply in recent weeks. The drop pushed the price back toward the $95 support zone. That level is key for the trade.
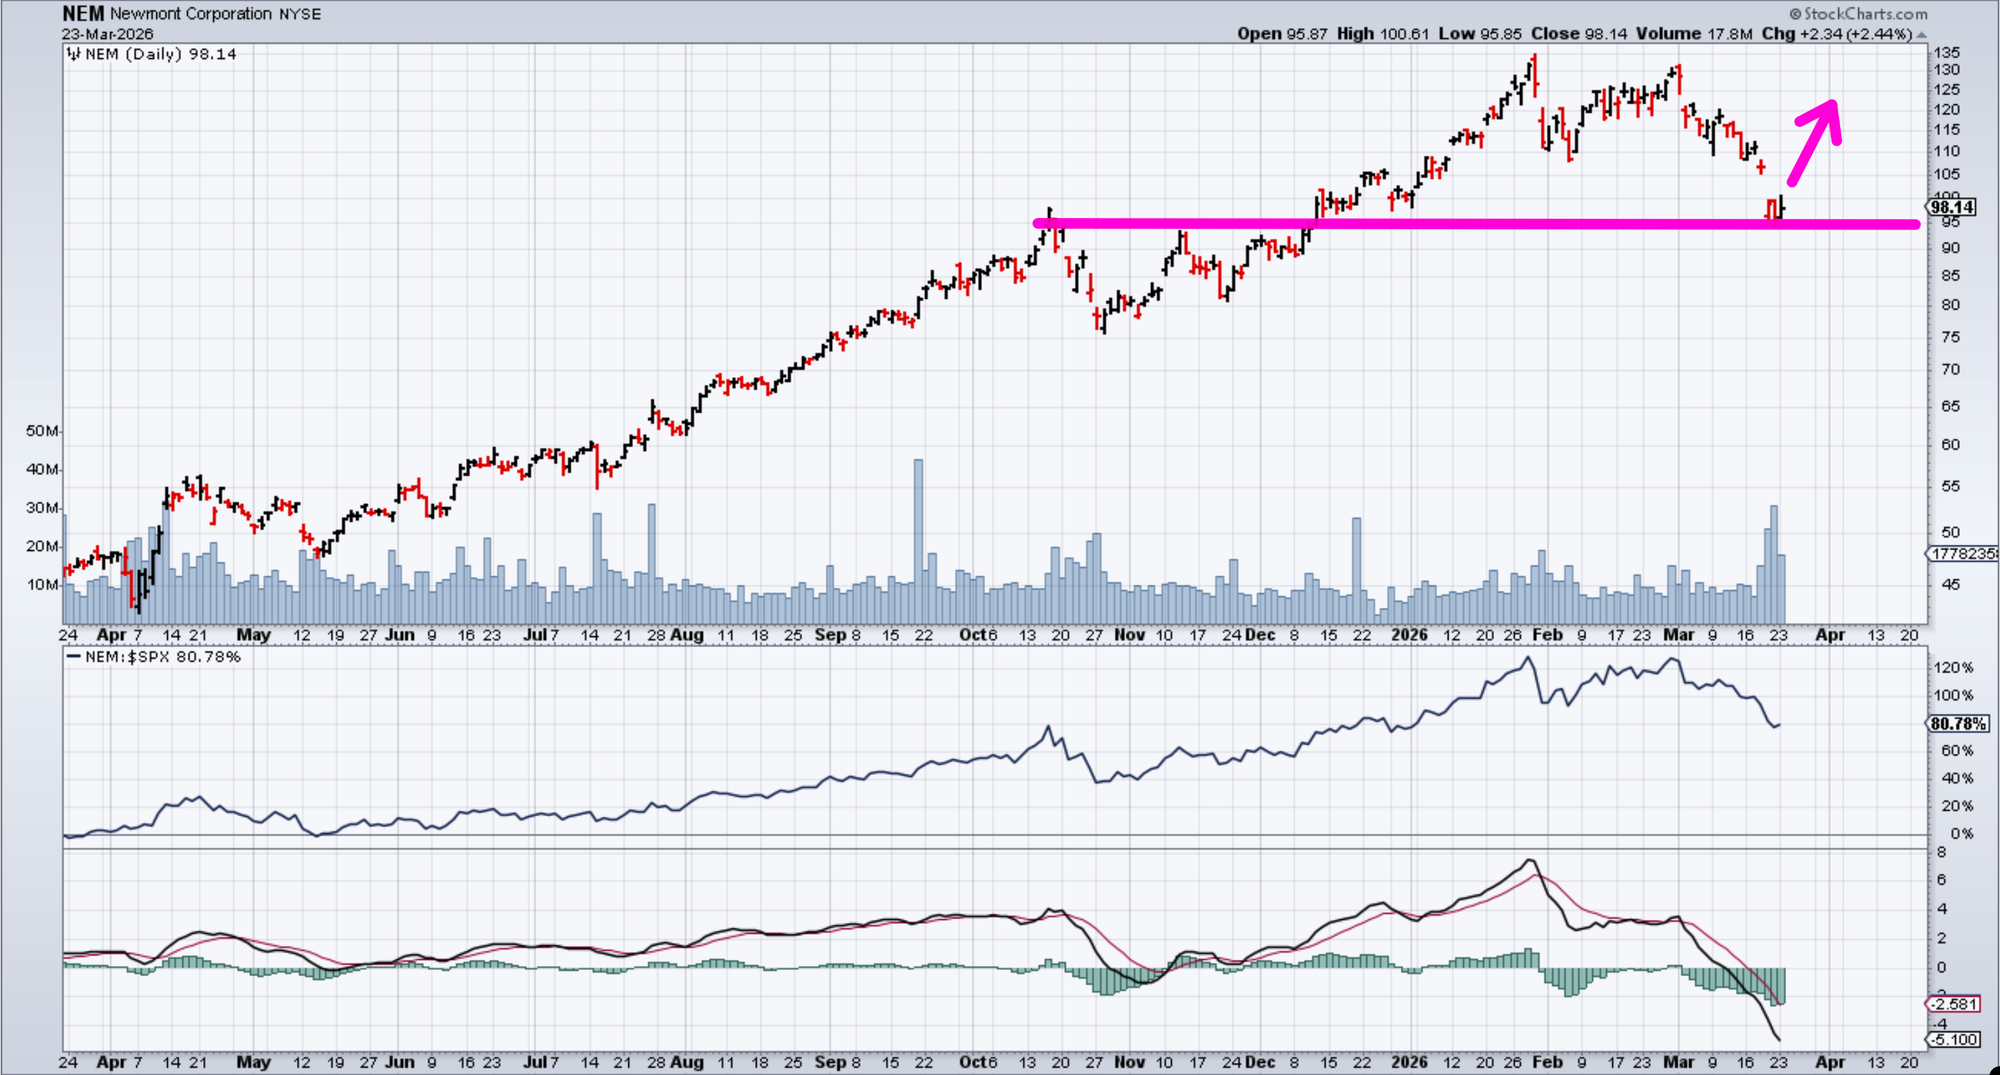
The speed of the sell‑off matters most. Momentum fell, the MACD went deep negative, and Newmont’s performance fell far behind the S&P 500. Because of that, the stock lit up a bullish counter‑trend scan.
The idea is simple: if selling pressure eases near $95, the stock does not need to race back to its highs. It only needs to hold steady and bounce a little.
This is a “buy the fear” move. You are not chasing strength. You are stepping in where fear may have gone too far.
Trading the Bounce with Options
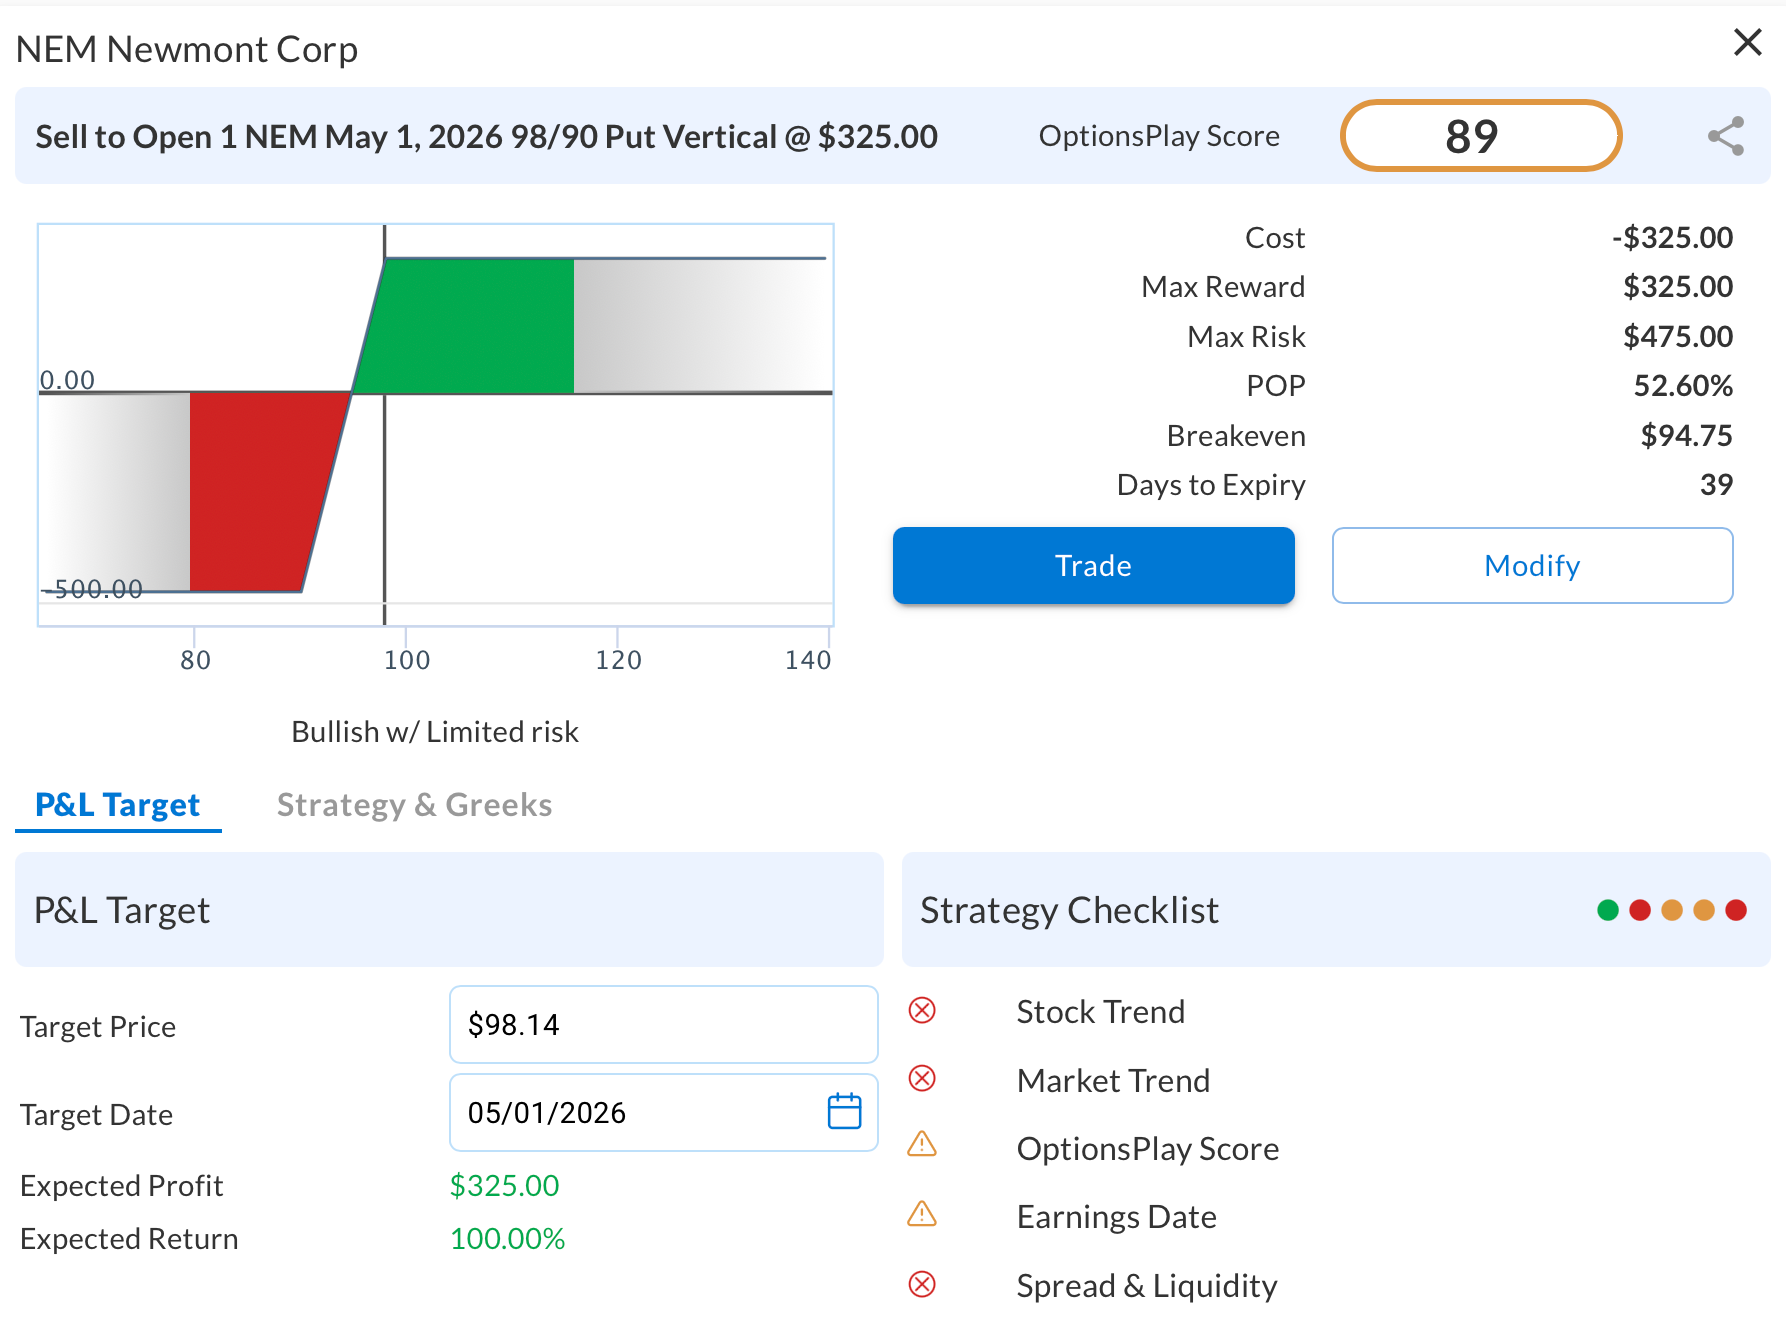
Instead of buying the stock, you can use a defined‑risk Bull Put Spread. The spread makes money if Newmont stays above support until the option expires.
Sell May 1 2026 $98 Put – receive credit
Buy May 1 2026 $90 Put – limit risk
Max risk: $2,400 (if price falls below $90)
Max reward: $1,600 (if price stays above $98)
Breakeven: $94.80 (about 3.4% below current price)
Risk/Reward: 1.5 to 1
Why This Trade Makes Sense
- No big rally needed: Newmont only has to stay above $94.80, right around the support zone.
- Risk is capped: You know the maximum loss from the start.
- Oversold set‑up: A sharp liquidation creates a premium‑selling opportunity.
- High volatility helps: With an IV rank around 77%, option premiums are rich, making the credit spread attractive.
The trade does not rely on gold jumping back up. It relies on the crowded precious‑metals trade cooling off, and Newmont finding a floor.
Finding Similar Trades Fast
Traditional research can take hours. You would scan dozens of stocks, study the macro picture, check options liquidity, and then build spreads.
With a good scanning tool, you can locate a set‑up in seconds. The tool looks for oversold stocks that have strong support, liquid options, and high implied volatility. It then scores each candidate.
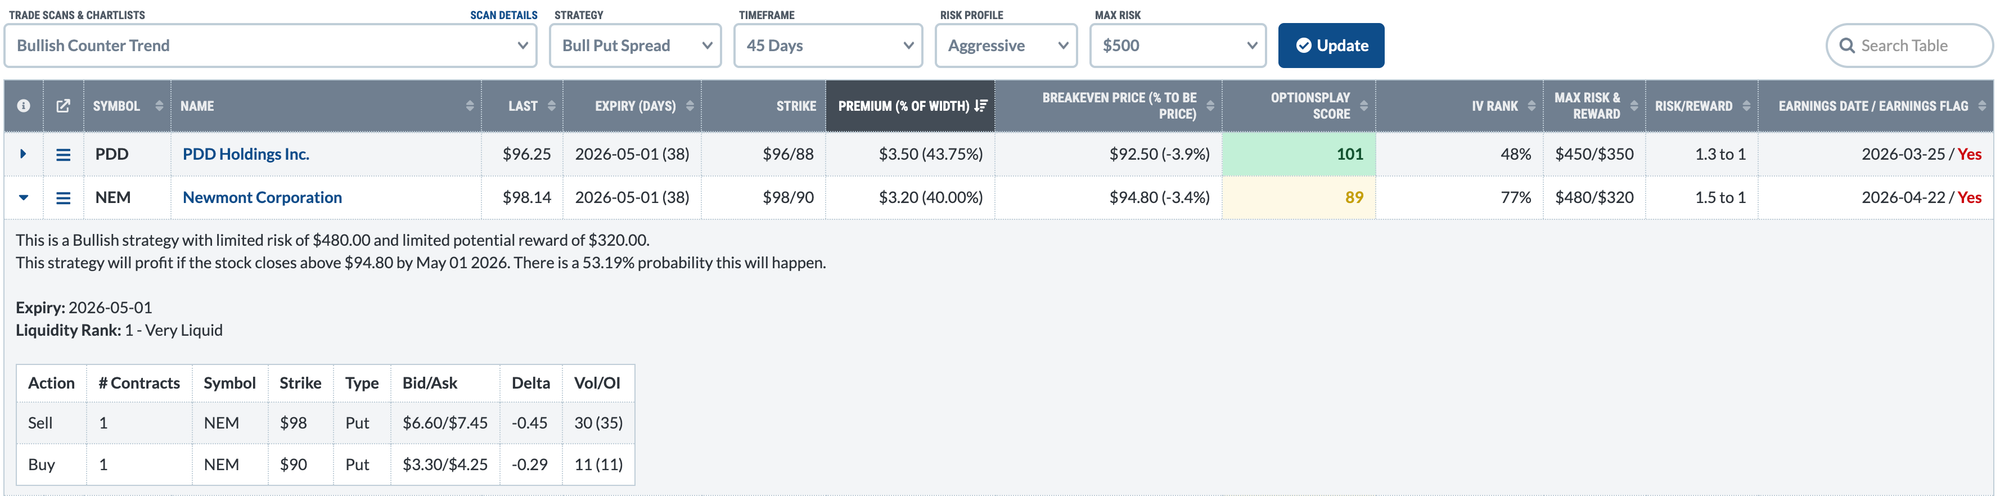
Newmont checked all the boxes: oversold, support near $95, high IV, and a defined‑risk spread that breaks even below support. The result is a high‑confidence trade that can be entered quickly.
Bottom Line
This is not a new gold breakout. It is a counter‑trend chance that appears after a panic‑driven sell‑off in a crowded precious‑metals trade. The Bull Put Spread works because it only needs the stock to hold near $95, not to surge. Using a focused scan lets you find this kind of setup in seconds, giving you confidence and speed.
Options trading involves risk and may not be suitable for all investors. This article is for educational purposes only and does not constitute investment advice.
Source: Materials provided by https://articles.stockcharts.com.Note: Content may be edited for style and length.