
CAC40 Closes Higher
The French CAC40 cash index finished the session up 0.92%, reaching 7,772.45 points with a strong trading volume of €4,527 billion.
The Paris stock market moved higher, largely because of growing tensions in the Middle East. The Houthis, backed by Iran, have stepped up their actions, and the United States is considering more military help. These moves keep oil prices high.
Attacks on Iranian energy sites and worries about the Strait of Hormuz – a key route for world oil – add extra pressure. In France, the Prime Minister mentioned Iranian comments about letting "non‑hostile" ships pass, seeing a possible change but urging caution.
Energy companies stand out in this environment. Engie rose 3.84% to €27.86, and TotalEnergies gained 3.22% to €81.02, helped by higher oil prices linked to the Strait of Hormuz situation.
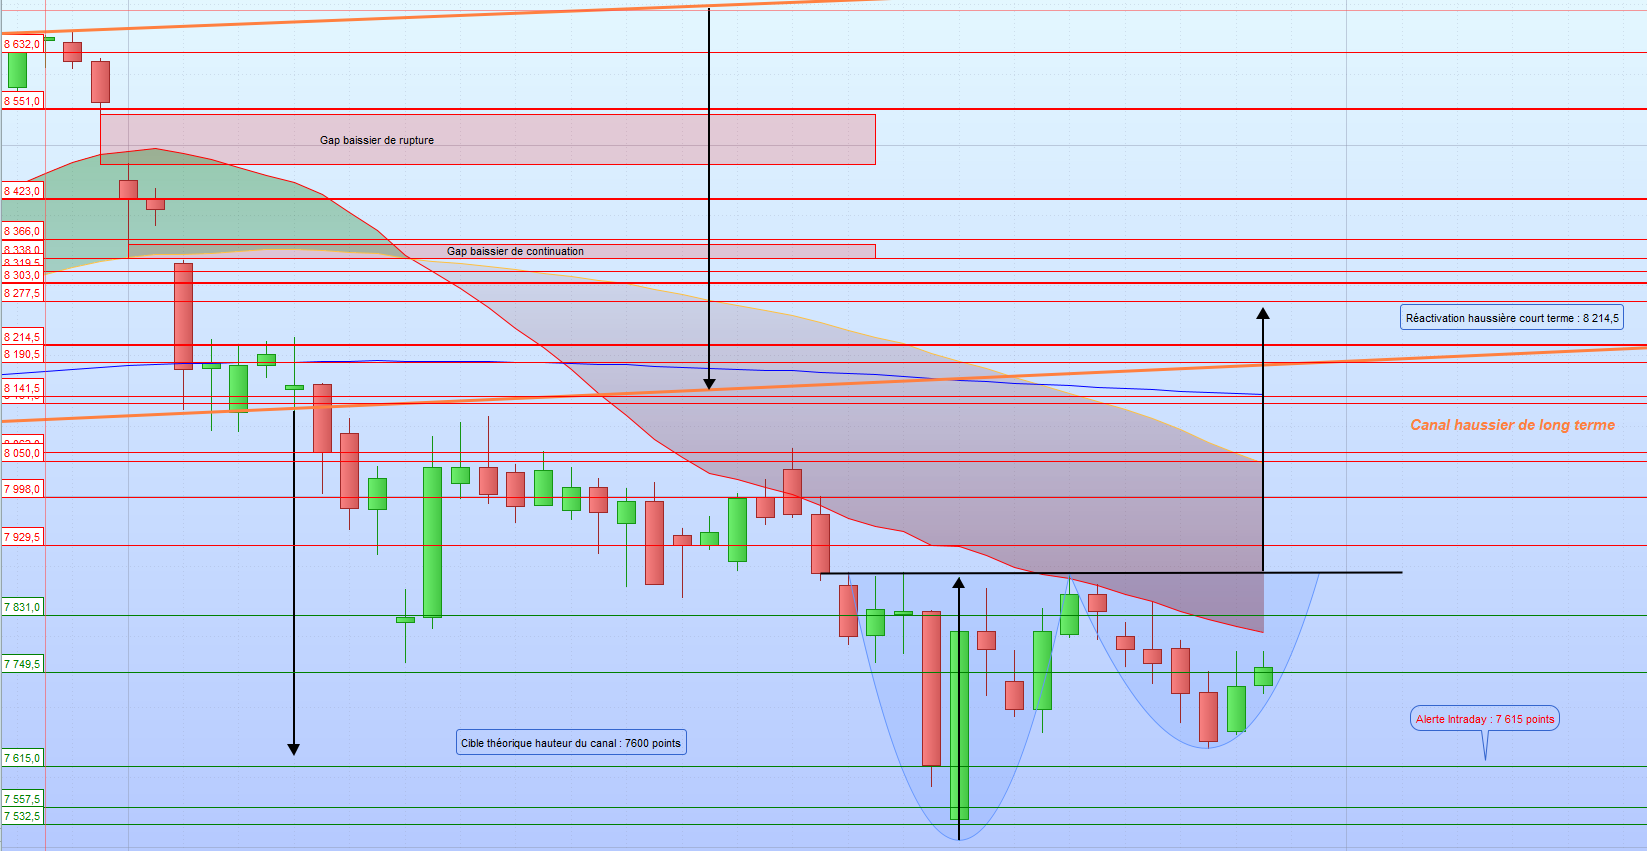
Future (April) Technical Levels
Resistance levels (price points where the market may stop rising): 7,929.5 → 7,998 → 8,050 → 8,062 → 8,131.5 → 8,190 → 8,214.5 → 8,277.5 → 8,303 → 8,338 → 8,366 → 8,423 → 8,551.
Support levels (price points where the market may find buying interest): 7,831 → 7,749.5 → 7,615 → 7,557.5 → 7,532 → 7,398.5.
During the day, the market showed a bullish bias above 7,745 points.
On a chart taken at 14:00, the CAC40 futures broke out of its intraday alert zone at 7,615 points, thanks to buying pressure. Since March 19, a "cup with handle" pattern has been forming. If the price breaks clearly above the cup’s top at 7,791 points with good volume, the pattern could target around 8,277 points.
Before that, crossing the intermediate resistances at 7,929.5 and 7,998 points (and possibly 8,050) would signal a stronger upward move. A calm geopolitics outlook and lower oil‑price tension would also help stocks rise.
If the price falls back below the cup’s handle, the bullish scenario would be invalid. The market could then slide toward the 7,600‑point area, which aligns with the lower edge of the long‑term upward channel. Holding above this level is crucial. A break lower might push the index toward the next supports at 7,557.5 and then 7,398.5 points.
Technical indicators show the index below its 20‑, 50‑, and 200‑day moving averages. The MACD histogram is rising but still under the signal line. The RSI is neutral, and volume is down compared with the previous session.
Conclusion
Because the market reacts to geopolitical news, we keep 65% of a dynamic portfolio invested in equities. This reflects a constructive view as long as the index stays above the low points from March 23. A de‑escalation could happen at any time, and profit‑taking may be wise when the price reaches the lower edge of the old long‑term channel.