
CAC40 Close Summary
The CAC40 cash index ended the day down 2.03% at 7,807.87 points, with a trading volume of €6.646 billion.
The Paris market fell sharply. Energy prices rose sharply and Jerome Powell gave a careful outlook on future interest‑rate cuts.
The U.S. Federal Reserve kept rates steady, but the chance of easing policy this year now looks uncertain because of ongoing geopolitical tension.
In Europe, the European Central Bank also held rates steady. It warned that inflation could stay high while growth stays weak. The ECB expects inflation to be 2.6% in 2026, then near 2%, and growth around 0.9% in 2026, rising slowly afterward.
Energy Market Pressure
Oil prices (Brent) settled around $112 per barrel after reaching $119.40 earlier in the session. European gas prices jumped, with the Dutch TTF benchmark hitting €74 per MWh – a rise of up to 35% before easing to about 14%.
The Emirate region supplies roughly 20% of the world’s LNG. Damage to its facilities could keep supply disturbed for a long time, even if a cease‑fire is agreed.
Future March Contracts
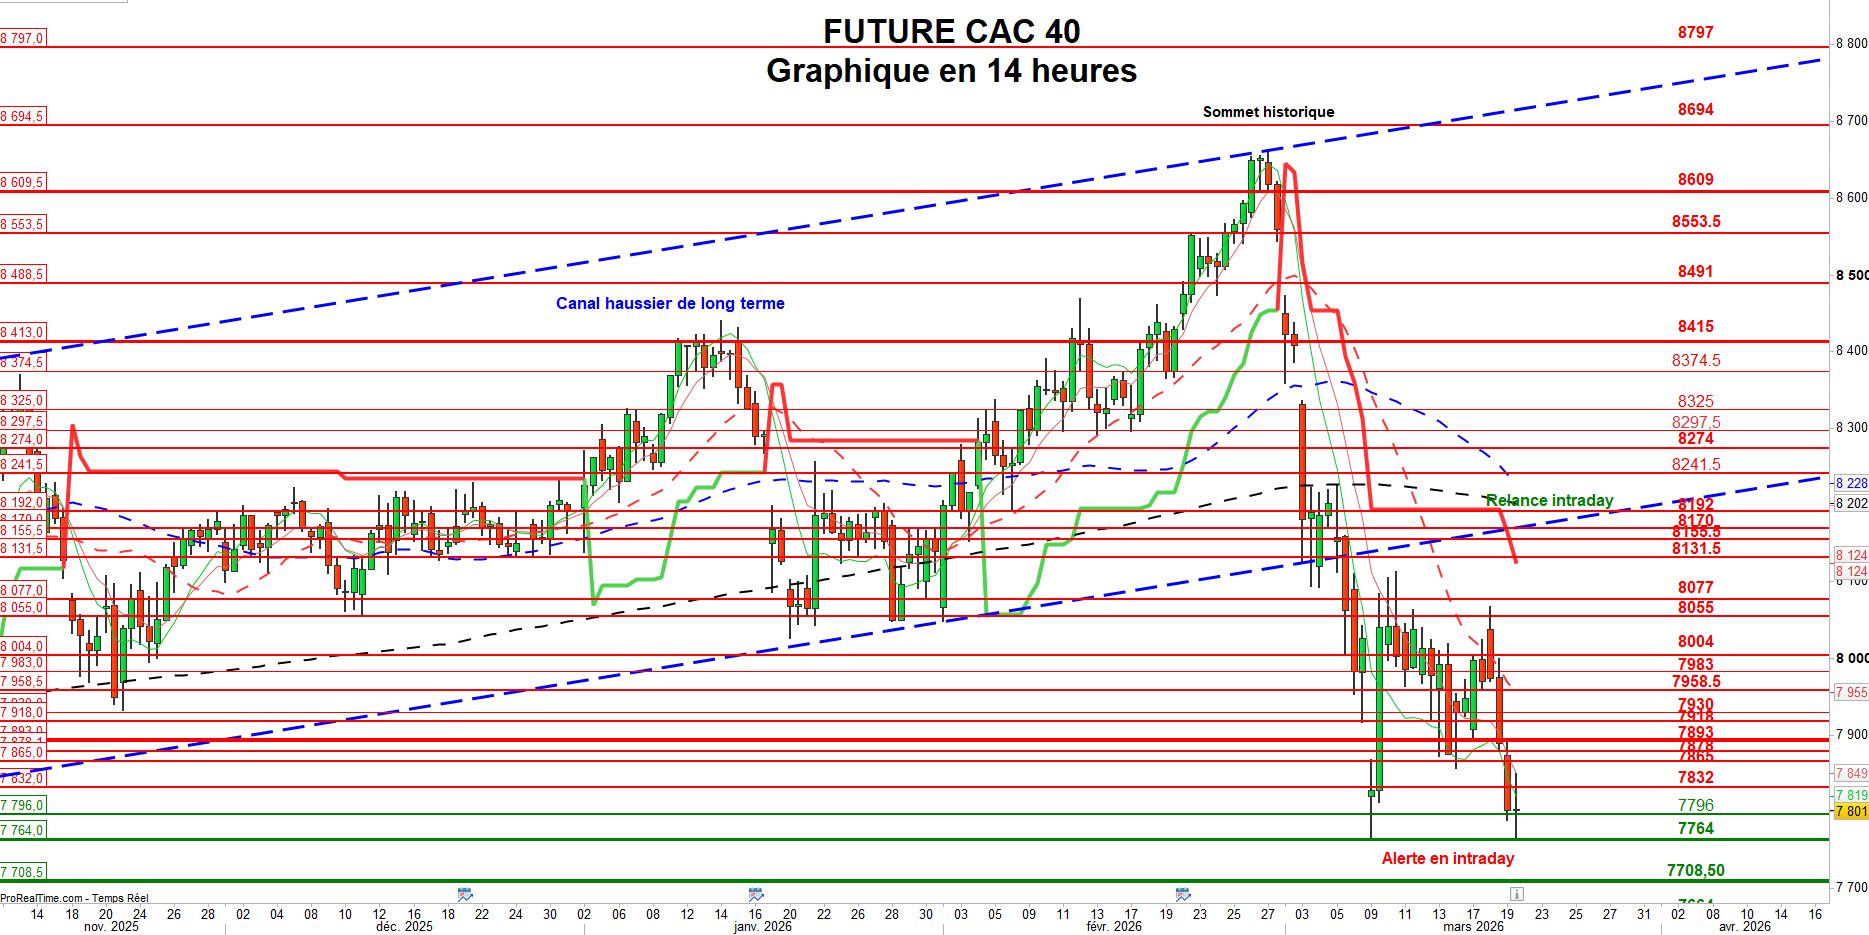
Resistance levels: 7,832 – 7,893 – 7,944 – 7,990 – 8,048 – 8,077 – 8,099.5 – 8,117 – 8,135 – 8,141.5 – 8,149.5 – 8,171 – 8,249.5 – 8,264.5 – 8,297.5 – 8,326 – 8,353.5 – 8,374.5 – 8,430.5 – 8,563 – 8,688.5 – 8,812 – 8,916 – 9,030 – 9,338.
Support levels: 7,764 – 7,740.5 – 7,615.5 – 7,574 – 7,466.5 – 7,330 – 7,164.
During the day the market bias stayed bearish below 7,922 points.
Technical View
The March CAC40 future stayed under pressure. After a brief bounce, the index opened lower, creating a gap between 7,944.34 and 7,887.95 points.
The first support at 7,831 points broke, while the second support at 7,764 points (the low of March 9) helped a short technical rebound.
If the index falls below the 7,764 level, the correction that started on March 2 could restart, especially as geopolitical tensions rise between Israel, the United States and Iran.
In that case, the index might head toward the long‑term channel low near 7,600 points, with further support around 7,574 – 7,466.
Indicators show the MACD histogram turning down again, the RSI in oversold territory, and volumes increasing – signs of growing selling pressure.
What Traders Need to Watch
For buyers to feel hopeful, the market must first close the day’s gap above 7,944.34 points. The next hurdle is the March 18 high at 8,068 points.
If those levels are passed, the main goal will be to re‑enter the long‑term upward channel, whose lower bound is now around 8,170 points. Two earlier gaps on March 2 and 3 still block a full recovery.
Conclusion
Today’s strong down‑move triggered many stop‑loss orders, a key tool for protecting portfolios. Because the outlook is still unclear, we do not recommend adding to positions yet. We will wait for clearer signals before adjusting any strategy.