Market summary
The French CAC 40 index ended the day at 7,969.88 points, a small drop of 0.06%. Trading volume was about €5.46 billion. The market moved up and down, wiping out the gains that were seen around midday.
Why the market is jittery
Recent attacks on energy facilities in the Middle East have made investors nervous. Some of the strikes hit the large South Pars gas field shared by Iran and Qatar, and other plants in the Gulf region were also targeted. These events have increased risk aversion across markets.
Traders are also waiting for two important central‑bank decisions. The U.S. Federal Reserve will announce its policy stance tonight, and the European Central Bank will do the same tomorrow. Most people think the Fed will keep rates unchanged, but they will be looking closely at the Fed’s economic outlook and any comments from Chairman Jerome Powell.
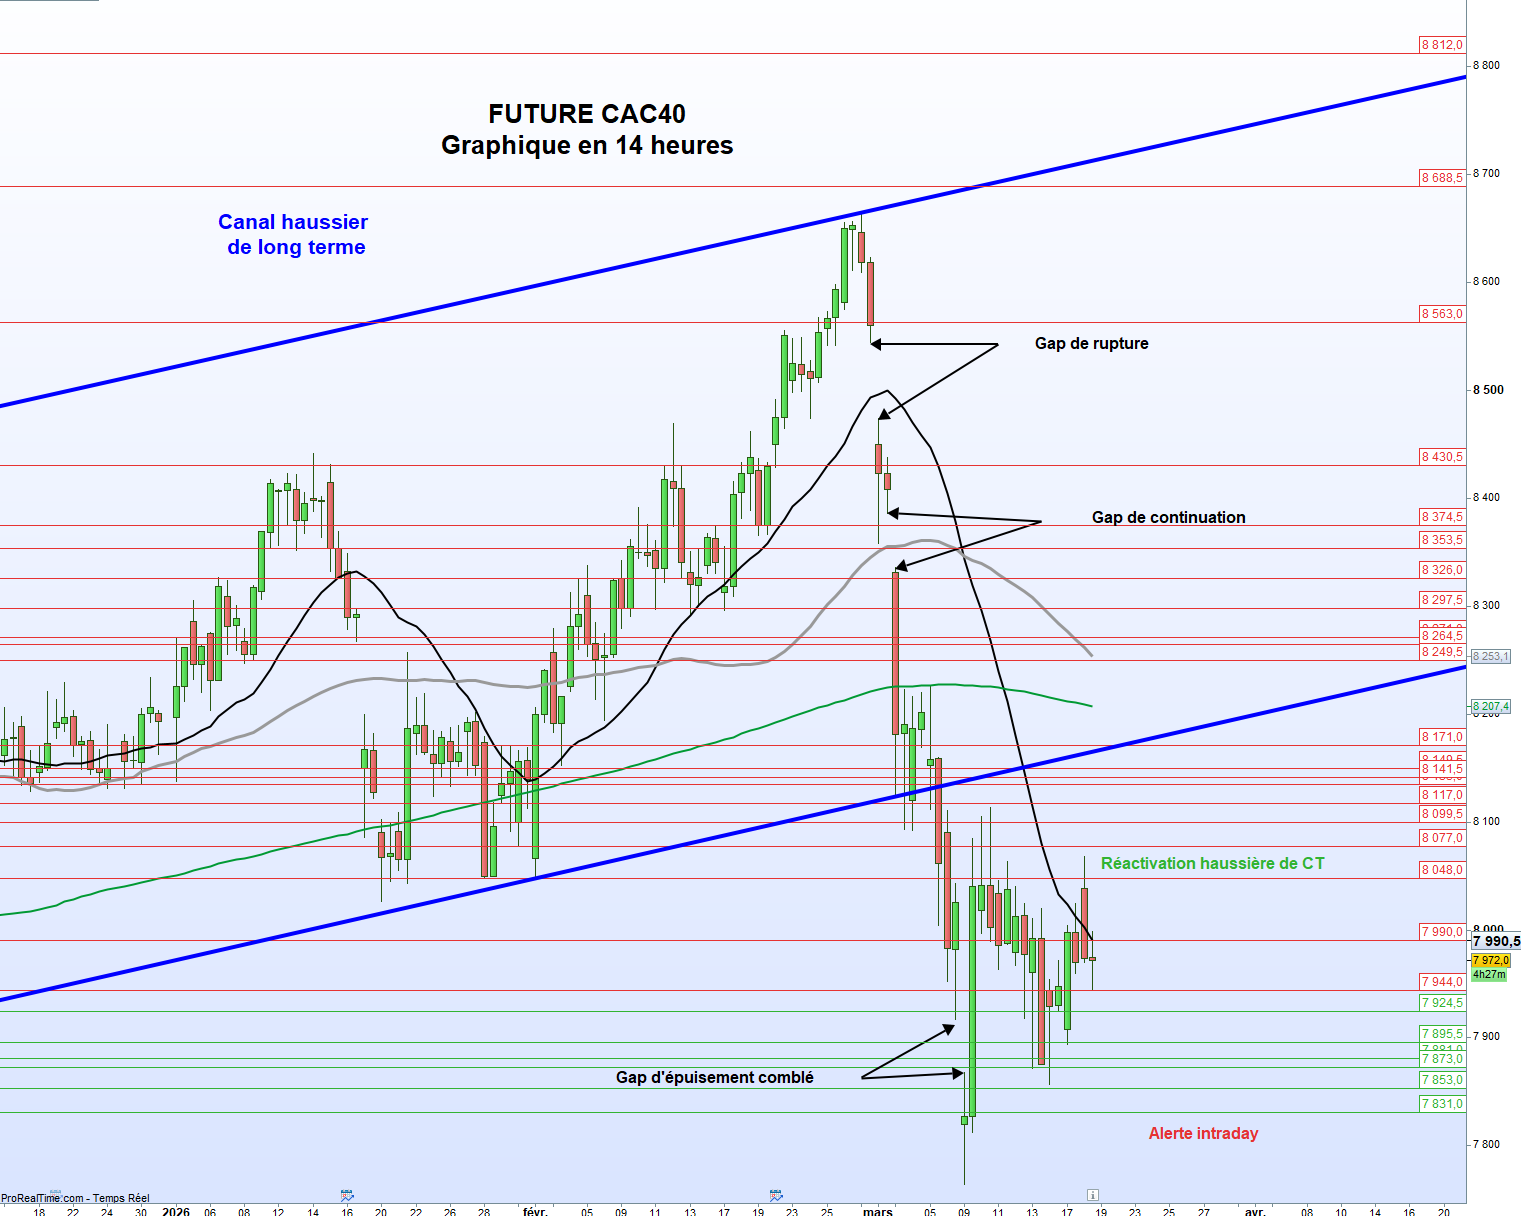
Technical picture for the March CAC 40 future
Resistance levels (areas where price may struggle to rise): 7,944 – 7,990, 8,048 – 8,077, 8,099.5 – 8,117, 8,135 – 8,141.5, 8,149.5 – 8,171, 8,249.5 – 8,264.5, 8,297.5 – 8,326, 8,353.5 – 8,374.5, 8,430.5 – 8,563, 8,688.5 – 8,812, 8,916 – 9,030, 9,338.
Support levels (areas where price may find a floor): 7,924.5, 7,895.5 – 7,881, 7,873 – 7,853, 7,831 – 7,815, 7,740.5 – 7,615.5, 7,574 – 7,466.
During the trading day, the price stayed above the 8,048 point line, indicating a short‑term up‑trend.
Chart analysis
The future’s price moved in a choppy way, without a clear bounce. A long‑term down‑trend channel has its lower boundary at 8,164 points. Breaking above the channel’s upper edge at 8,385.5 and then 8,544 would signal a stronger recovery.
If the index can hold above 8,563 for three consecutive sessions, it could aim for the top of the channel at 8,712 points. A move past the historic highs would also end the weekly “triple‑top” pattern and point toward the next target around 9,338 points.
On the other side, falling below the minor support at 7,990 would suggest that the up‑trend is losing steam and could push the price toward the intraday alert level of 7,831 points. As long as the price stays above that level, the short‑term outlook stays neutral. A break lower would reopen the path toward the lower channel at 7,600 points and possibly the support zone between 7,574 and 7,466. The “neckline” of the triple‑top pattern sits at 7,164 points; a break there could open a slide toward the 6,000 point area.
Portfolio outlook
We continue to add to dynamic and investor‑focused portfolios, favouring the scenario where the market rebounds. However, the bounce is currently technical, and an unexpected event could reverse it. In that case, we would lock in profits and use protective hedges to guard our positions.