
CAC 40 Ends Lower
The CAC 40 cash index closed down 0.98%, at 7,915.36 points, with an average volume of €4.694 billion.
The Paris stock market fell further because energy prices jumped to new highs. Crude oil reached about $119 per barrel, a level not seen since the Ukraine war began in 2022. The rise is linked to ongoing problems in the Strait of Hormuz, a key route for about 20 % of the world’s oil trade. The Gulf states are cutting production, and investors worry about a lasting energy shock.
These worries raise the chance of "stagflation" – high inflation together with weak growth. Bond yields are also climbing: the German 10‑year Bund rose over 3 basis points and the French OAT moved up about 7 basis points, now above 3.6 %.
Among stocks, ArcelorMittal fell 3.88% to €46.04 after a broker cut its rating. In contrast, Thales gained 2.57% to €247.5, helped by the tense geopolitical backdrop.
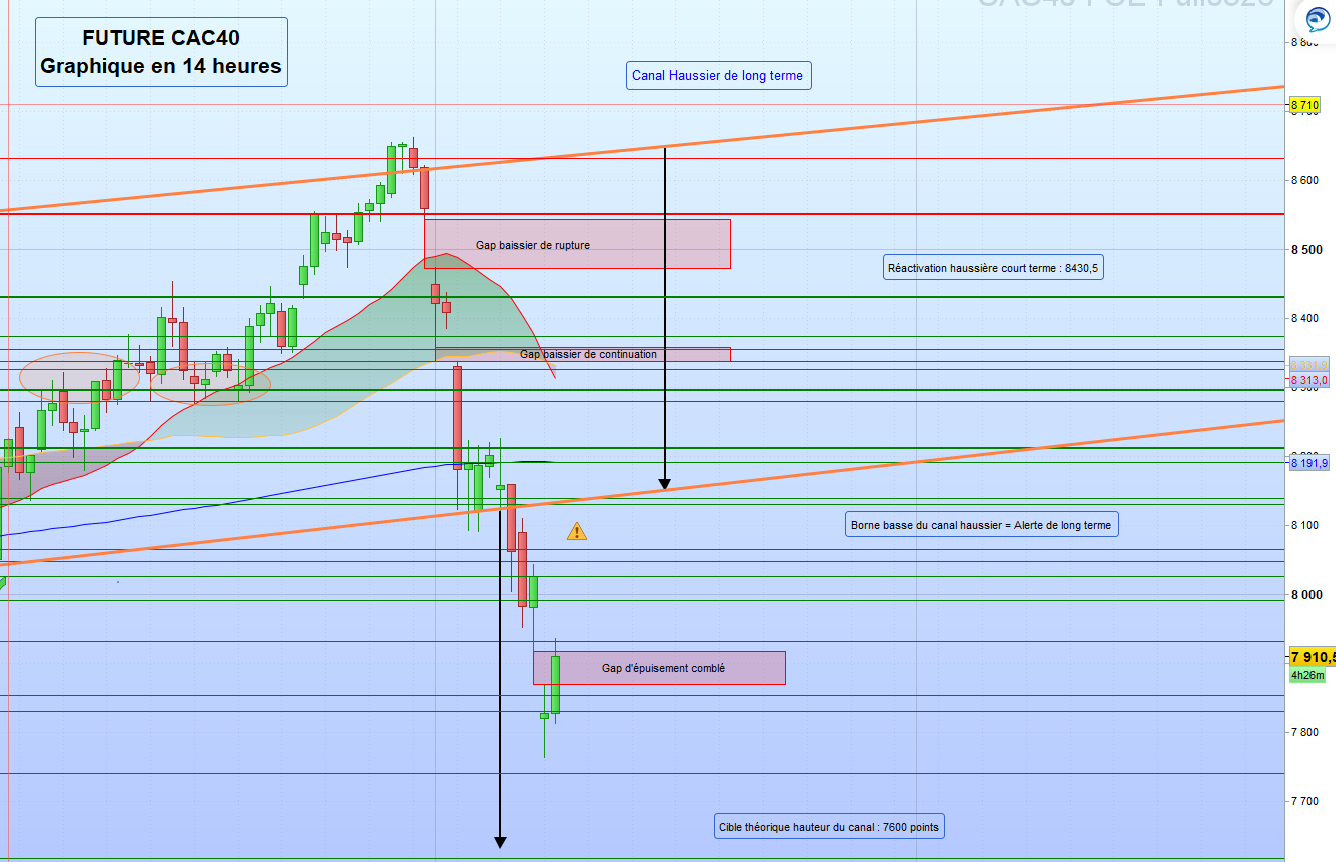
Future (Futures) Technical Levels
Resistance levels: 8,551 → 8,632 → 8,810 → 8,910
Support levels: 8,430.5 → 8,373.5 → 8,355 → 8,338 → 8,326 → 8,279.5 → 8,212 → 8,191.5 → 8,139 → 8,131 → 8,065 → 8,048 → 8,026 → 7,991.5 → 7,853 → 7,831 → 7,740.5 → 7,615.5
Intraday bias is bearish below 7,935 points.
Chart Summary (14:00 data)
The CAC 40 futures are still trending down in the short term. The index is now in a delicate technical zone. To avoid a bigger drop, it must stay above the upper edge of the previous trading range at 7,991.5 points. Breaking that level could push the price down to the next supports at 7,853, 7,831, and 7,740.5 points. If sellers keep the pressure, the index could fall toward 7,600 points, which matches the long‑term down‑trend channel.
On the brighter side, the 14:00 candle shows buyers stepping in after an opening gap down. They closed a gap of more than 100 points (7,913.02 → 7,812.66), suggesting the short‑term decline may be tiring. A move above the old supports now acting as resistance – around 8,026, 8,048 and 8,065 points – would be a first sign of technical improvement. A sustained rise back into the long‑term up‑trend channel near 8,212 points would create a more positive outlook. Filling the continuation gap (8,336‑8,358) and the local breakout gap (8,473.5‑8,544) would also help change the current momentum.
Indicator Check
- The index trades above its 20‑, 50‑ and 200‑day moving averages.
- MACD histogram is rising, though still below the signal line.
- RSI is in the oversold zone.
- Trading volume is higher than yesterday’s session.
Conclusion
The market opened with a bearish gap that looked like an "exhaustion" move. Buyers later counter‑attacked, so we started a buying position on the index using bullish speculative products (Dynamic and Investor portfolios). If the gap fully closes, it could signal the end of the short‑term downtrend and hint at a possible reversal. At the same time, we keep adding solid companies with good technical signals and fundamentals, such as Saint‑Gobain and Interparfums, to our portfolios.