

After a whirlwind week of jobs data, earnings, and macro headlines, the S&P 500 (SPX) has stayed confined within a narrow corridor. Since the October 2025 consolidation, the index has been hovering around the same price levels, prompting a fresh look at key support and resistance points as the market seeks direction.
Below we explain how the current sideways action reflects a broader shift from growth‑focused leaders to value‑oriented stocks, and we highlight the technical signals worth monitoring as February draws to a close.
Reading a Market in Balance
Tracing the daily chart back to the April 2025 low reveals an early‑year surge that mellowed into a low‑volatility uptrend through summer. A decisive break below the 50‑day moving average in November hinted at a possible trend change.
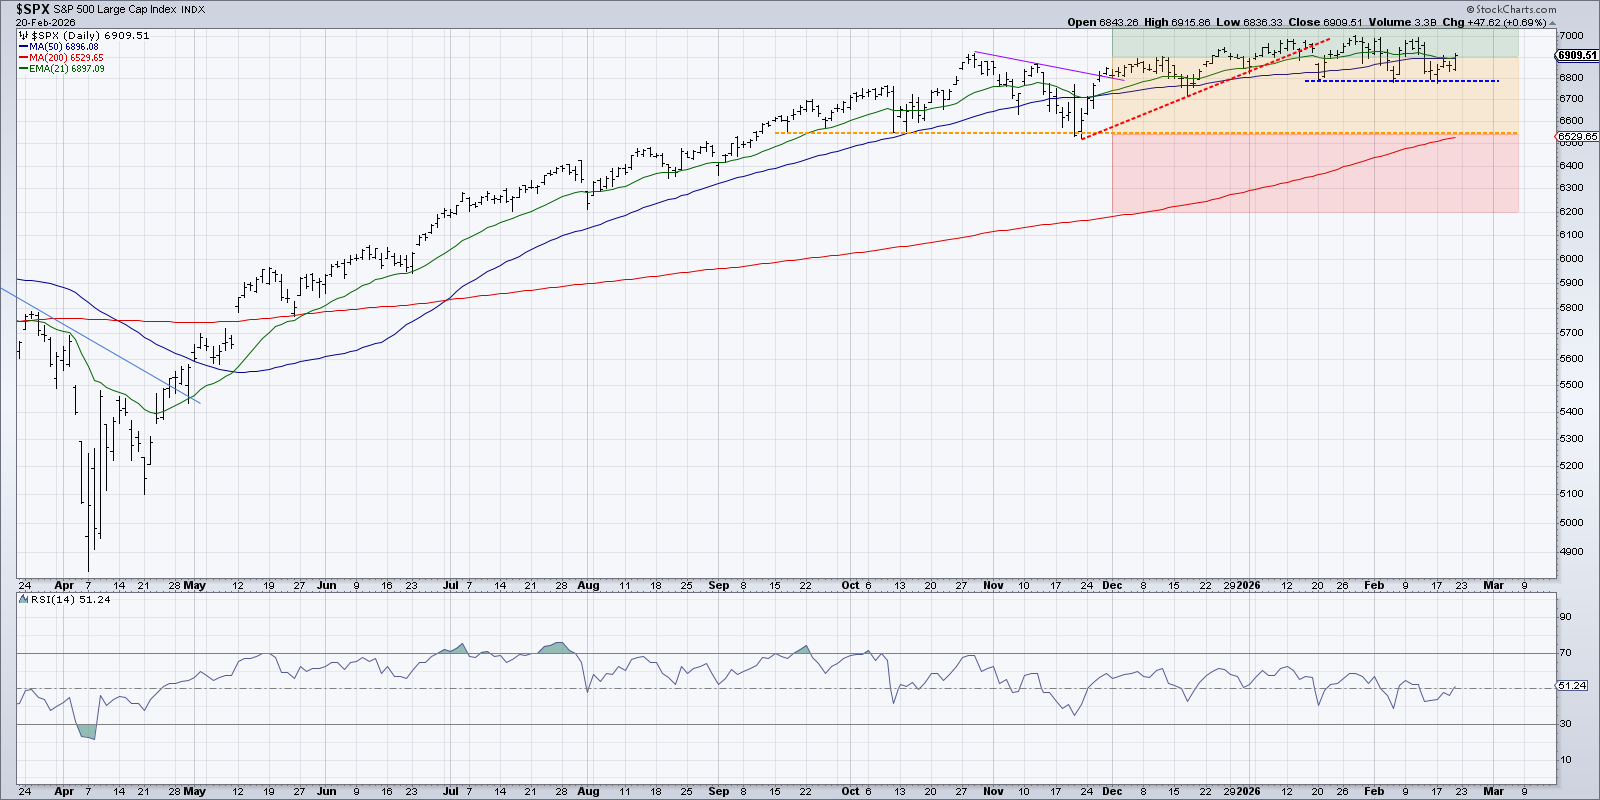
Although the 50‑day line failed to hold, the index found a foothold near the mid‑October swing low. Subsequent trend‑line breaches produced an upside breakout around Thanksgiving and a short‑term breakdown in January.
Closing the week just above 6,900 – the same level seen at the end of October – the index’s headline price has barely moved, even as individual stocks display far more activity.
Re‑calibrating the Traffic‑Light Zones
Zooming into the last six months, we can apply a simple traffic‑light framework:
- Green zone: above 6,900 signals bullish bias.
- Red zone: below 6,550 suggests a major breakdown.
- Yellow zone: between those levels implies a neutral stance.
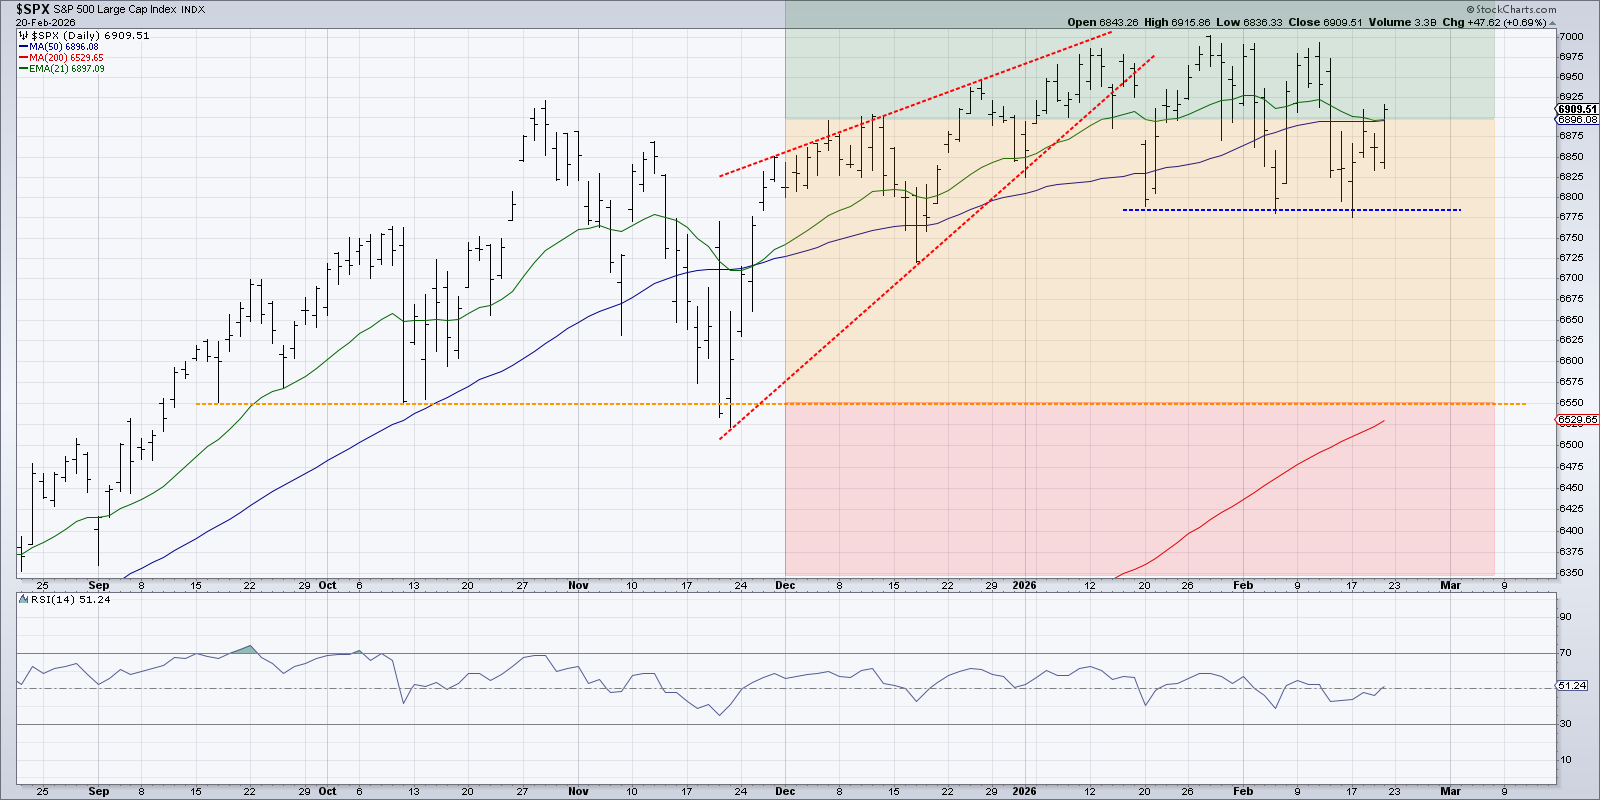
A rising‑wedge pattern formed from late November to mid‑January, narrowing the price range as the index climbed. The wedge’s breakout did not trigger a sharp decline; instead, it ushered in the present sideways market.
Over the past month the index has settled into a “range‑within‑a‑range,” with short‑term support near 6,780 and resistance close to the all‑time high of 7,000. A dip below 6,800 could reopen the path toward the 200‑day moving average, where additional support may be found.
Momentum as the Confirmation Tool
At this stage, momentum indicators become the decisive factor. The Relative Strength Index (RSI) has hovered around the 50‑point midpoint, indicating a balance between buyers and sellers.
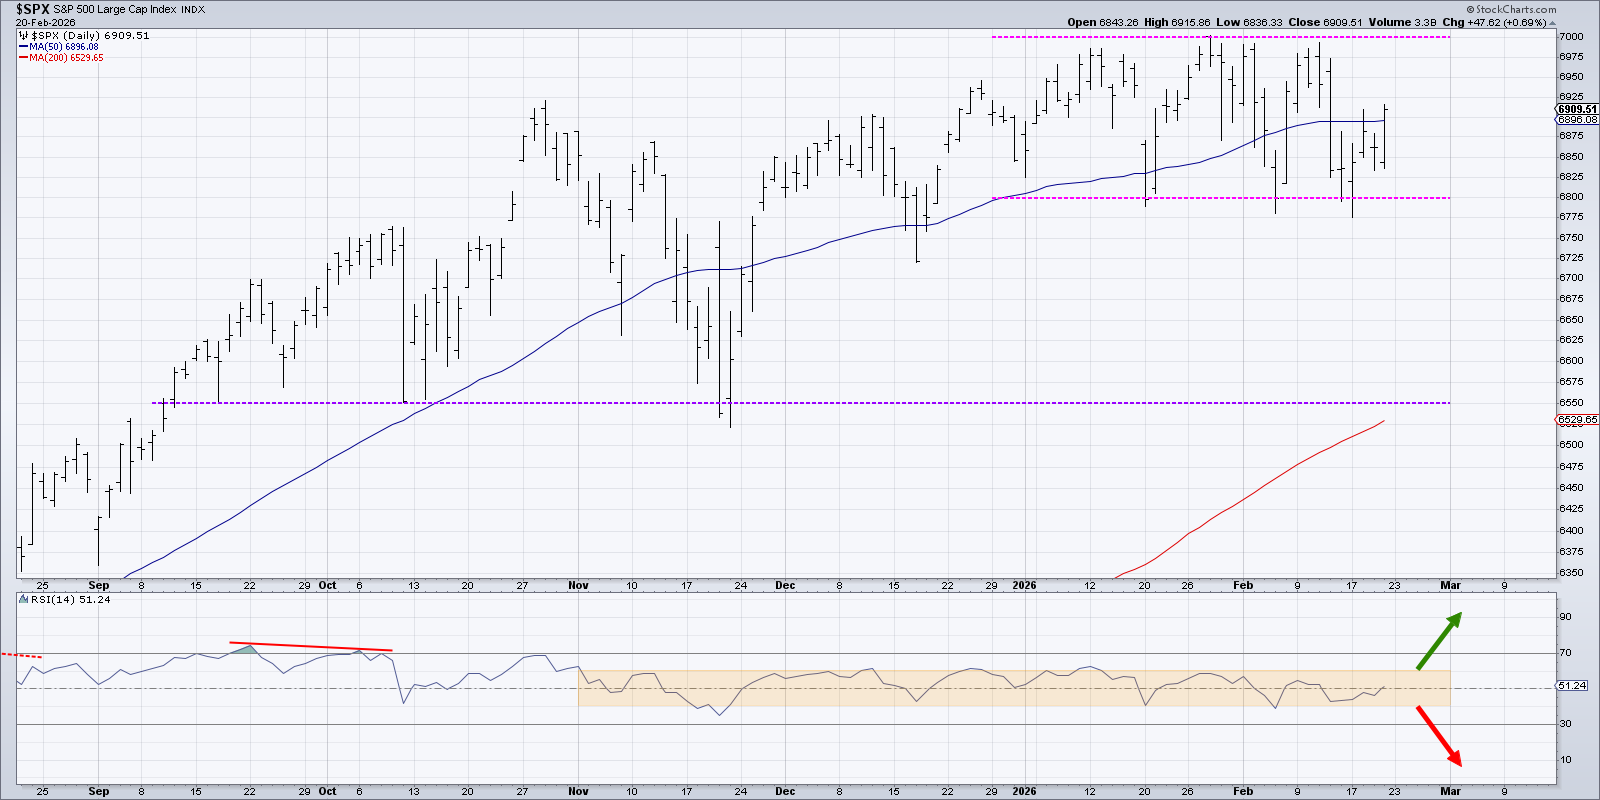
For a bullish breakout, we would look for the index to breach 7,000 while the RSI climbs above 60, signaling strengthening buying pressure. Conversely, a fall beneath 6,800 accompanied by an RSI drop under 40 would confirm bearish momentum and raise the likelihood of a further slide, especially given the seasonal weakness typical of a mid‑term election year.
In summary, the S&P 500 remains locked in a tight corridor. By tracking the revised support‑resistance thresholds and pairing price moves with clear momentum shifts, traders can position themselves for the next decisive swing.
Disclaimer: The material presented here is for educational purposes only and does not constitute financial advice. Readers should evaluate their own circumstances and consult a qualified professional before acting on any investment ideas.
Source: Materials provided by https://articles.stockcharts.com.Note: Content may be edited for style and length.