
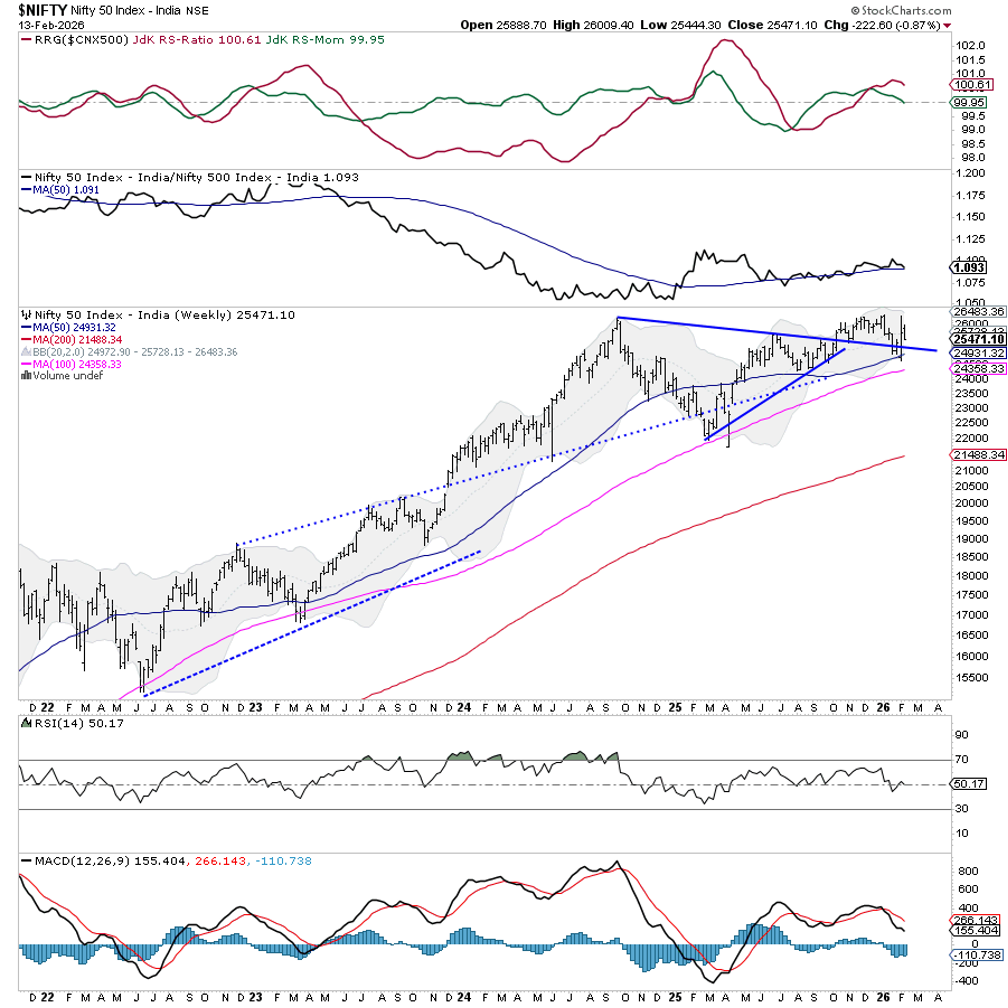
During the past week the market moved inside a relatively narrow 565‑point corridor, showing a noticeable downside bias. After opening toward the upper end, Nifty tried to break the 26,009 mark but quickly lost steam, drifting lower and eventually touching an intra‑week low of 25,444 before closing near the bottom of the range. The India VIX jumped 11.3% to 13.29, signaling heightened nervousness. Overall, the index shed 222.6 points, or about 0.87%.
On a longer horizon the index remains in a medium‑term uptrend, yet it is currently in a corrective swing. The weekly chart shows Nifty slipping under its 20‑week moving average (25,728) while still sitting above the 50‑week average (24,931), placing it in a delicate support pocket. Prices have been testing the lower edge of a descending trend‑line, and the 24,900‑24,950 zone now acts as a pivotal floor. A decisive break beneath this range could open the path to a deeper pullback toward 24,350‑24,400. Conversely, a clean rally back above the 25,800‑26,000 corridor would neutralize the present weakness.
Looking ahead, the market may open cautiously, with the VIX suggesting possible volatility bursts. Immediate resistance sits at the 20‑week MA around 25,728 and the psychological 26,000 barrier. Support levels to watch are 25,100 and the aforementioned 24,950 zone.
The weekly RSI now reads 50.2, having slipped from recent highs and positioning itself in neutral territory—no clear divergence is evident. The MACD stays above zero but has fallen beneath its signal line, hinting at eroding upward momentum. The latest candle formed a bearish body after a period of indecision near the highs, pointing to increasing supply at elevated levels.
From a pattern standpoint, the index is sketching a short‑term topping formation. Failure to remain above the upper Bollinger Band and a drift back toward the middle band underscore fading strength. Beneath the price, the 50‑week (24,931) and 100‑week (24,359) averages offer a layered support zone, while the upward‑sloping 200‑week average reinforces the long‑term bullish bias despite the near‑term pressure.
Given this backdrop, a measured, stock‑specific stance is prudent. Traders should hold off on fresh aggressive longs until Nifty either reconfirms above 25,800 decisively or steadies around the 24,900‑24,950 support band. Protecting existing profits should take priority over chasing momentum, and disciplined risk control will be essential in the coming days.
Sector Rotation Outlook for the Upcoming Week
Relative Rotation Graphs (RRG) benchmarked against the CNX500 (NIFTY 500) reveal which sectors are likely to outperform. The Nifty PSE Sector Index has moved back into the leading quadrant, indicating relative strength. The IT index, while still in the leading quadrant, shows signs of losing momentum.
Other sectors currently residing in the leading quadrant include Services, Bank Nifty, PSU Bank, Metal, and Financial Services – all candidates for relative outperformance. Auto and the Midcap 100 indices sit in the weakening quadrant, whereas Infrastructure displays improving momentum despite its placement.
Pharma has slipped into the lagging quadrant, and FMCG remains lagging as well. The Realty index is beginning to recover, while Media and Energy are located in the improving quadrant, suggesting potential upside.
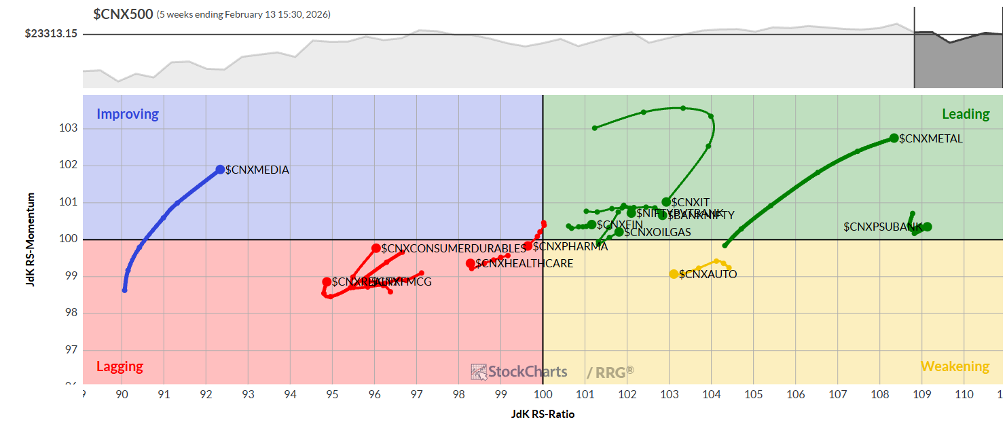
Remember, RRG charts illustrate relative strength and momentum among groups of stocks. They are not direct buy or sell signals but help in identifying sectors that may lead or lag the broader market.
Source: Materials provided by https://articles.stockcharts.com.Note: Content may be edited for style and length.