

Quick Primer…
The sector drill‑down screen gives you a snapshot of how each sector is performing relative to the rest. While the rankings are handy, they don’t tell you when or how to act. Professionals typically follow a repeatable process that extracts the most useful signals from those numbers.
Below we walk through a practical, three‑step workflow that converts the sector drill‑down (also known as the sector summary) into a decision‑making framework you can run whenever you need fresh ideas.
Understanding What the Tool Shows (and What It Doesn’t)
Click the Sector Drill‑Down tab on the Market Summary page and you’ll see a table that ranks sectors by percentage change over the selected period.
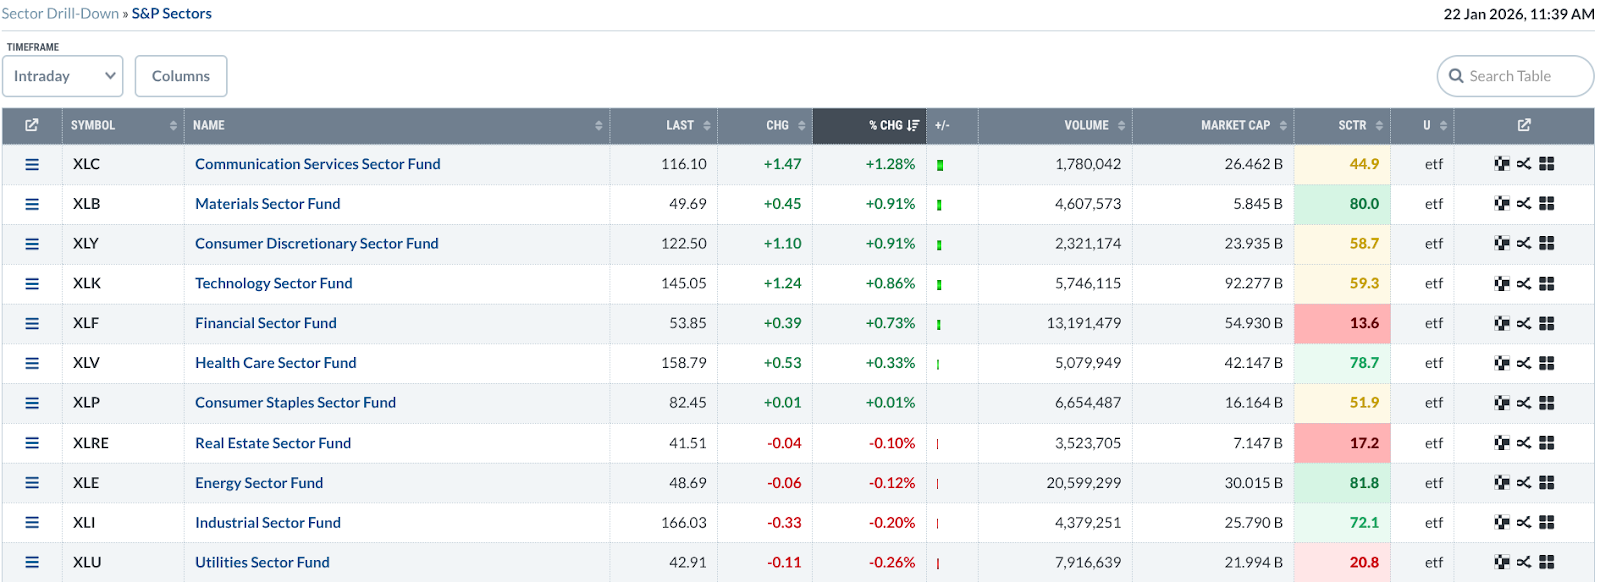
The table works as a relative‑strength engine. It tells you where money is currently flowing, but it does not prescribe entry points, trend quality, or timing.
- It highlights the direction of capital over the chosen horizon.
- It does not indicate the precise moment to buy or sell.
- It gives no assessment of underlying trend strength.
Choosing the right timeframe is the first decision you’ll make. Below is a quick guide that aligns common trading styles with a suitable look‑back period.
| Trading Style | Suggested Timeframe |
|---|---|
| Day trading | Intraday – 1 week |
| Swing trading | 1 month – 3 months |
| Position trading | 3 months – 6 months |
| Long‑term investing | 6 months – 12 months |
John Murphy advises a three‑month look‑back as a sweet spot: long enough to capture meaningful trends but short enough to avoid the noise that dominates daily charts.
Insider Tip #1: Align the drill‑down timeframe with how long you intend to hold a position.
For a day trader, the intraday view is essential, but a quick glance at the one‑week chart adds context. For swing traders, the three‑month view usually provides the clearest hierarchy of sector strength.
The Three‑Step Top‑Down Process
We’ll use the three‑month setting recommended by Murphy and walk through each phase.
Step 1 – Identify the Leading Sectors
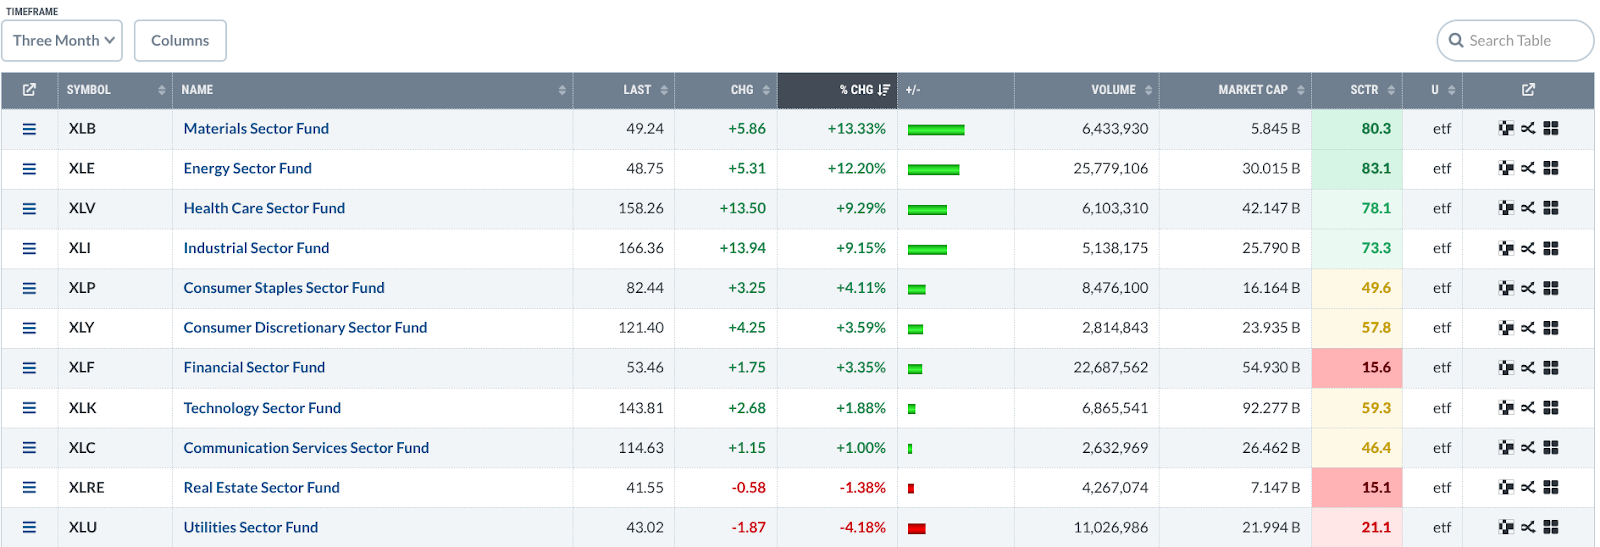
The default sort orders sectors by % change. Focus on the four highest performers – in our example they are Materials, Energy, Health Care, and Industrials. Their accompanying SCTR scores also rank near the top, confirming relative strength.
Insider Tip #2: Look for clear separation between the top sectors; a wide gap signals genuine leadership rather than market drift.
In the snapshot above the top two sectors outpace the third and fourth by more than a full percentage point, indicating capital rotation toward those groups. When sectors cluster tightly, the market may simply be drifting, offering fewer actionable cues.
Insider Tip #3: Beware of a single sector dominating the list – it can foreshadow narrow participation and heightened volatility.
Step 2 – Drill Down to Industries
Pick the leading sector (Materials in our case) and click to reveal the industry breakdown.
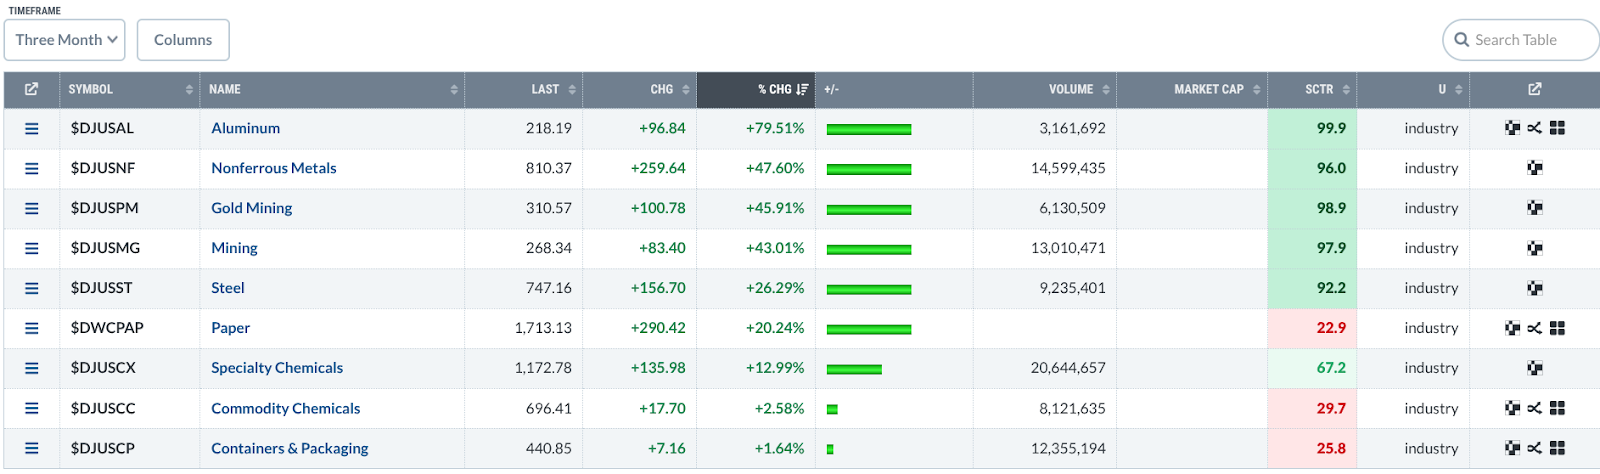
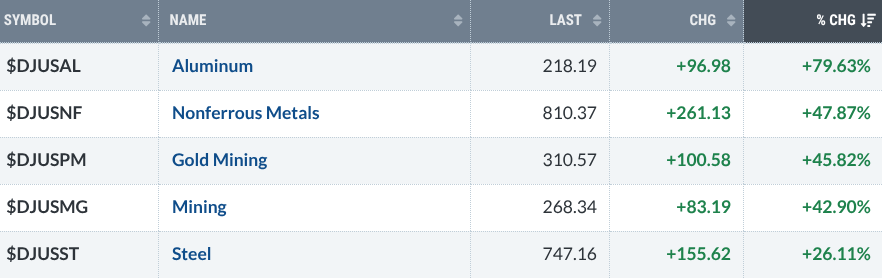
Within the sector, avoid sub‑groups that lag despite the sector’s overall strength. The industry table shows SCTR scores above 90 for all five leading groups, but Aluminum stands out with a % change of almost 80%, far ahead of the next best industry sitting near 40%.
Step 3 – Narrow to Individual Stocks
Now click the Aluminum industry to pull a list of constituent equities. Sort by SCTR to surface the strongest candidates.
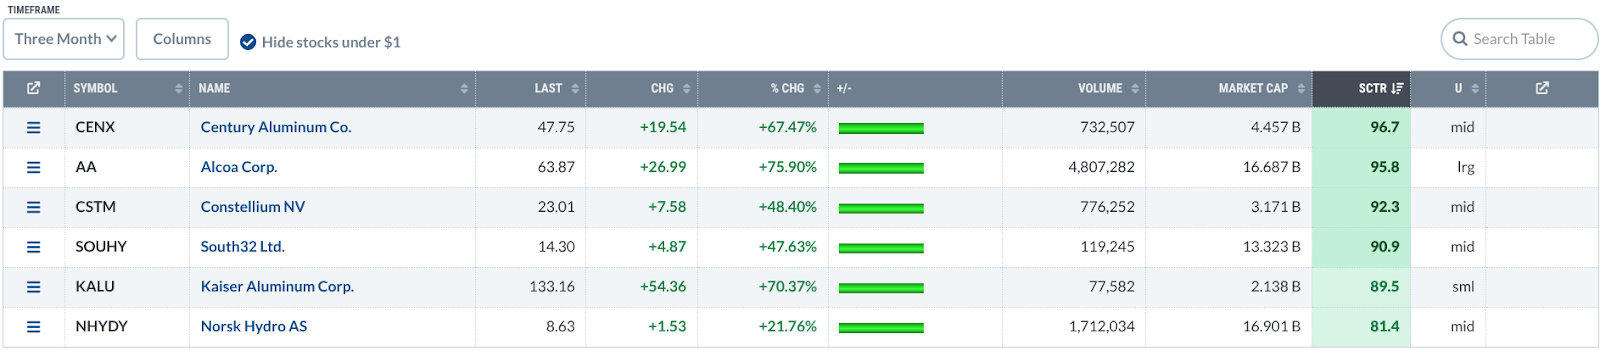
For illustration we’ll examine the top‑ranked ticker, Century Aluminum (CENX). Open its daily chart to verify that the technical picture aligns with the sector’s bullish bias.
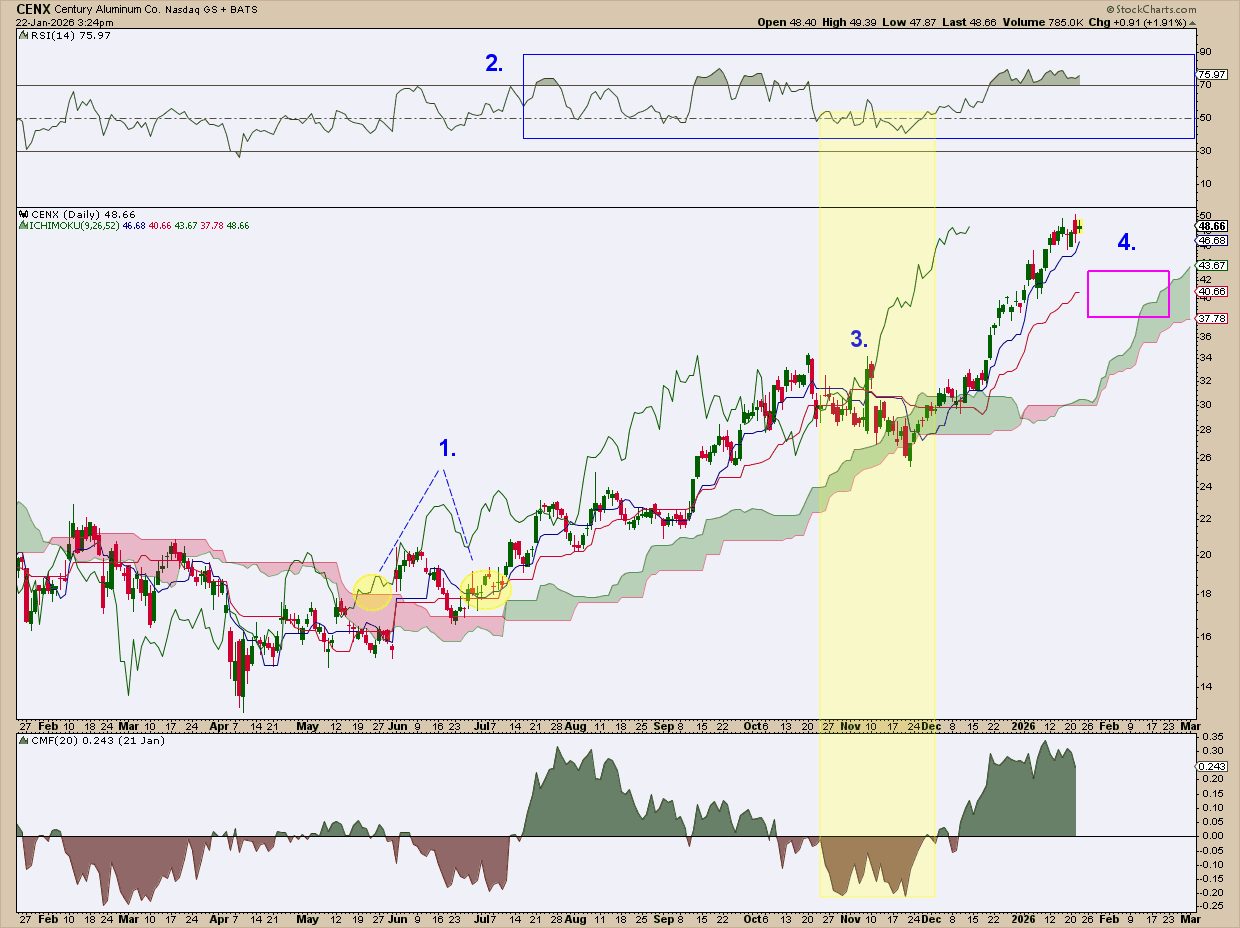
1. Confirm the trend. The price breaks above the Ichimoku Cloud and retests the Kijun‑sen, while the Chikou Span moves above price and the cloud – a classic bullish signal. A simultaneous surge in Chaikin Money Flow reinforces the upward bias.
2. Check momentum. The RSI stays above the 70 level most of the time, and when it pulls back it never falls below the 50‑40 zone, which is typical of a healthy bull market.
3. Observe support. A short‑term dip in November tested the cloud, found support, and bounced – demonstrating that the price floor is holding.
4. Be patient. Even with a strong chart, I would wait for a pullback toward the Kijun‑sen or into the cloud before adding a position, rather than jumping in at the current level.
The lesson isn’t about CENX specifically; it’s about the systematic process: start with sector leadership, drill into the strongest industry, then filter for stocks that exhibit solid technical confirmation.
Putting the Process Together
- Set the drill‑down view to a three‑month horizon (or adjust to match your style).
- Select the top‑ranked sectors.
- Within each sector, choose the industry showing the clearest outperformance.
- Sort the industry’s stock list by SCTR and review each chart.
- If a ticker passes your technical criteria, add it to your watchlist or chart‑list.
Common Pitfalls to Sidestep
Don’t chase a stock just because it appears at the top of a short‑term list; the timeframe must align with your intended holding period. Remember that a sector can still be “leading” even when it’s in a downtrend – it’s simply falling less than its peers. Ignoring that nuance often leads to premature entries.
Final Thoughts
The real edge comes from applying a repeatable workflow to the raw sector data, not from the rankings themselves. By moving methodically from sector to industry to individual stock, and by respecting the appropriate timeframe, you convert a simple table into a powerful decision‑making engine.
Source: Materials provided by https://articles.stockcharts.com.Note: Content may be edited for style and length.