

Pressure is building across the heavyweight tech arena, and the ripple effect is reaching the broader market. After the tech‑focused QQQ slipped below a key low, financials have followed suit, and the S&P 500 (SPY) is now flirting with its benchmark trough. Meanwhile, investors are rotating toward defensive utilities and long‑duration Treasury bonds.
Equal‑Weight S&P 500 Outpaces Traditional Large‑Cap Index
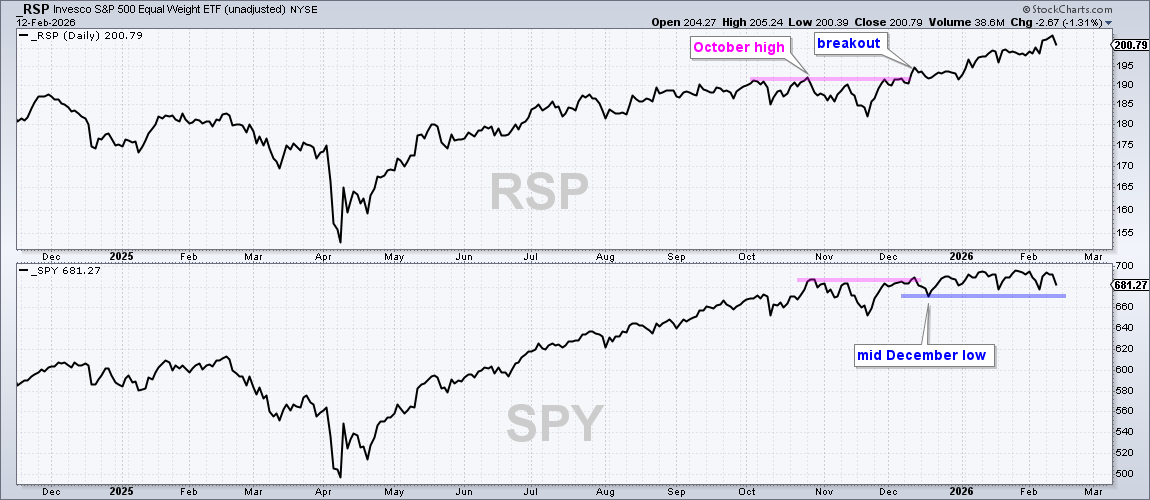
When you compare an equal‑weight S&P 500 ETF (RSP) with the market‑cap‑weighted SPY, the contrast is stark. RSP, which represents the average S&P 500 stock, has been climbing higher than the large‑cap benchmark, setting fresh 52‑week highs in December, January and February. In contrast, SPY managed a brief rally in mid‑December but has struggled to maintain momentum, leaving the large‑cap segment on the back foot.
Tech‑Heavy ETFs Show the First Dominoes Falling
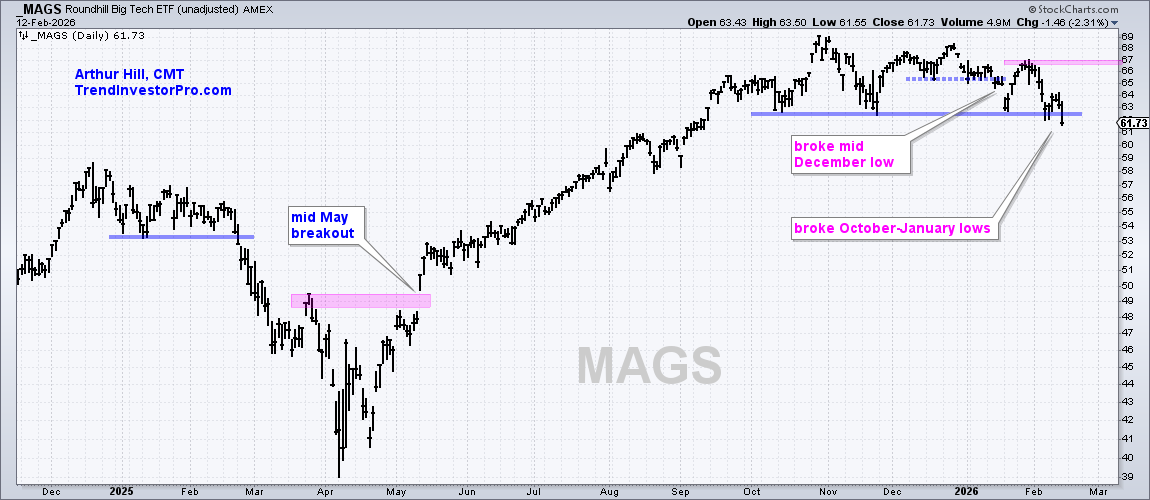
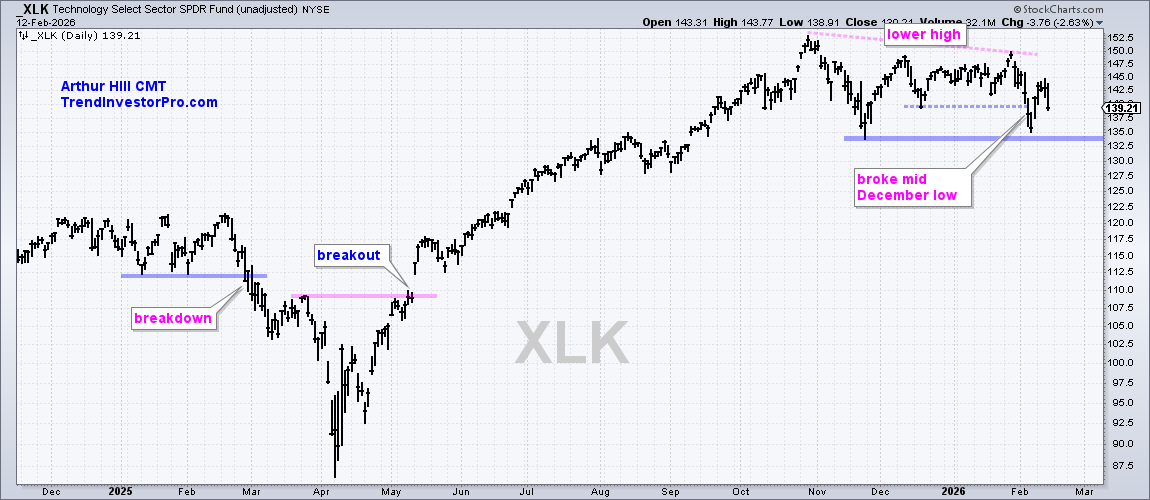
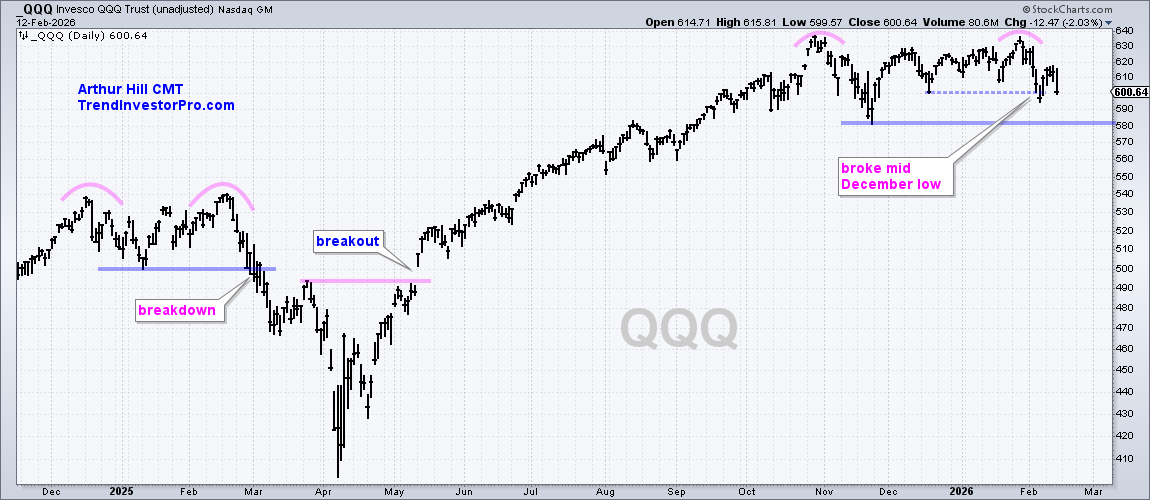
The cascade began when the Roundhill Big Tech ETF (MAGS) slipped beneath its December low on January 14. That breach signaled the start of a broader downtrend that later engulfed the Technology Select Sector SPDR (XLK) and the Nasdaq‑100 tracker (QQQ). Both XLK and QQQ have now broken the same December low, forming lower highs and reinforcing a bearish tilt.
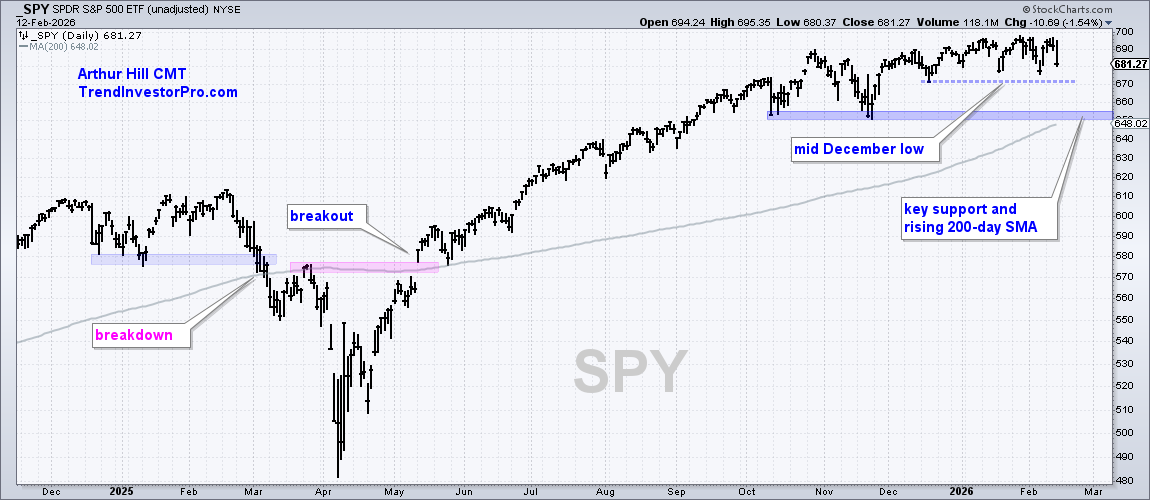
SPY Teeters Above a Critical Support Zone
The S&P 500 ETF has been testing the 670‑680 range three times since mid‑December. A decisive close below 670 would add SPY to the falling domino line, while a bounce would keep the large‑cap rally alive. Long‑term support sits near the 650 mark, aligned with the 200‑day moving average.
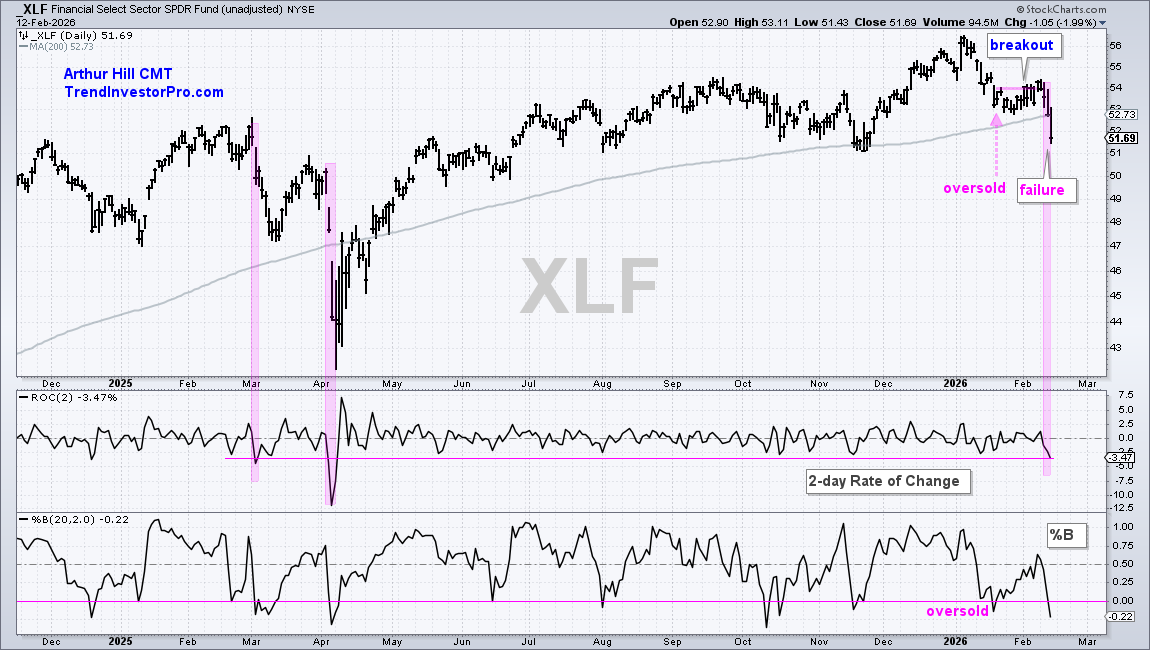
Financials Suffer a Sharp Two‑Day Drop
The Financial Select Sector SPDR (XLF) looked oversold earlier this year, but the brief bounce evaporated as the fund fell 3.5% over two days, breaking its rising 200‑day average. Although the move was dramatic, it did not instantly flip the broader market trend. Nonetheless, the sell‑off highlights the vulnerability of the sector that makes up roughly 13% of the S&P 500.
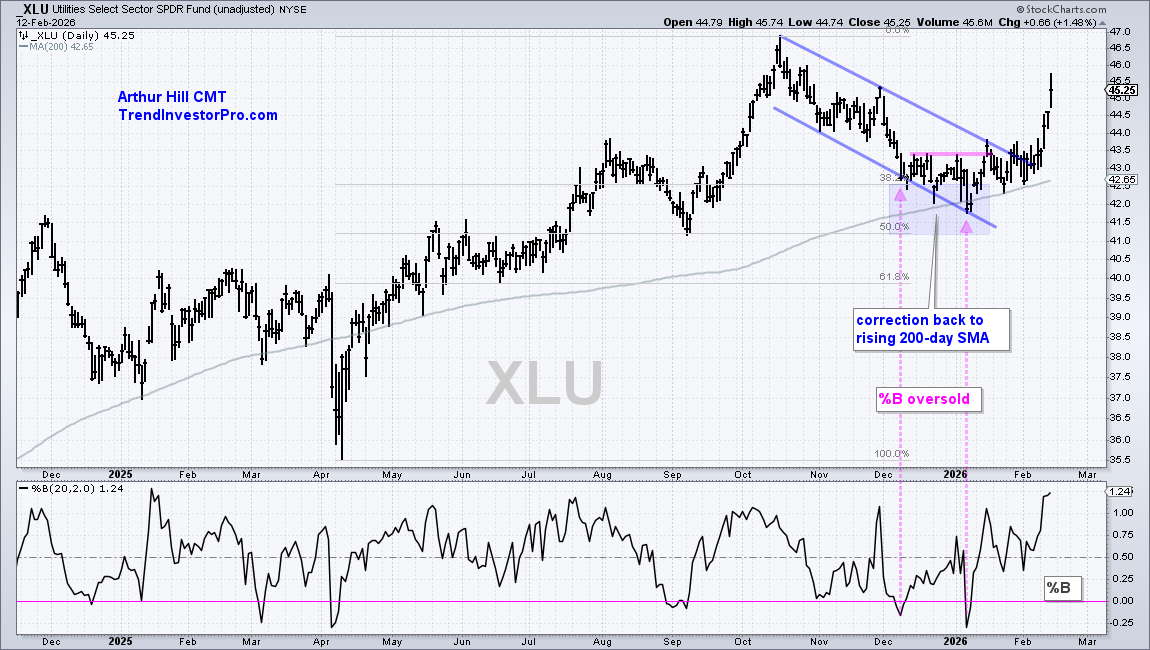
Defensive Utilities and Treasury Bonds Find Favor
As investors flee the lagging large‑cap arena, utilities and intermediate‑term Treasury bond ETFs have stepped into the spotlight. The Utilities Select Sector SPDR (XLU) displayed a classic correction pattern: after a run to new highs, it retraced roughly 45% of its advance and settled near the rising 200‑day average, setting up a potential upside breakout.
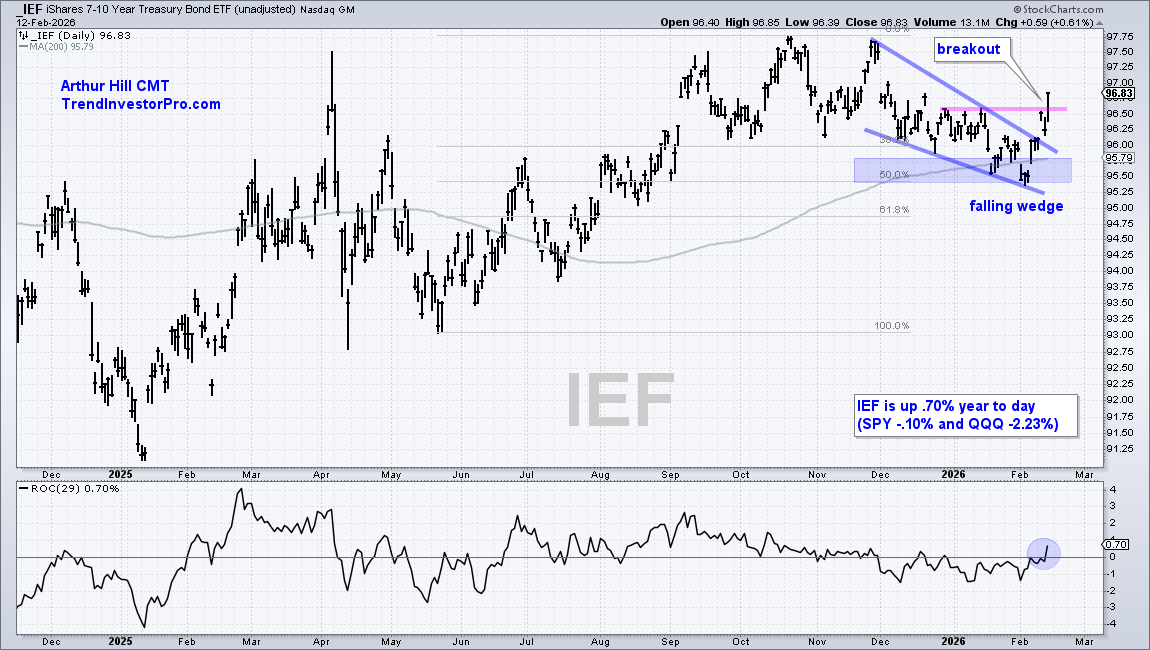
Similarly, the iShares 7‑10 Year Treasury Bond ETF (IEF) recovered from an early‑month breakdown, breaking above its 200‑day line and forming a falling‑wedge pattern that suggests continued upward momentum. Year‑to‑date, IEF is modestly positive, outpacing both SPY and QQQ.
Overall, the market narrative points to a rotation from high‑beta, large‑cap tech exposure toward more defensive assets. Traders should watch the 670 level on SPY and the 200‑day moving averages on sector ETFs for further clues about where the next move may originate.
Source: Materials provided by https://articles.stockcharts.com.Note: Content may be edited for style and length.