

- Energy reclaimed the top spot while I was away.
- Weekly RRG shows strong rotations into Materials, Industrials and Energy.
- Tech and Communication Services fell out after long runs.
- Both equal‑weight and cap‑weight baskets lag the S&P 500.
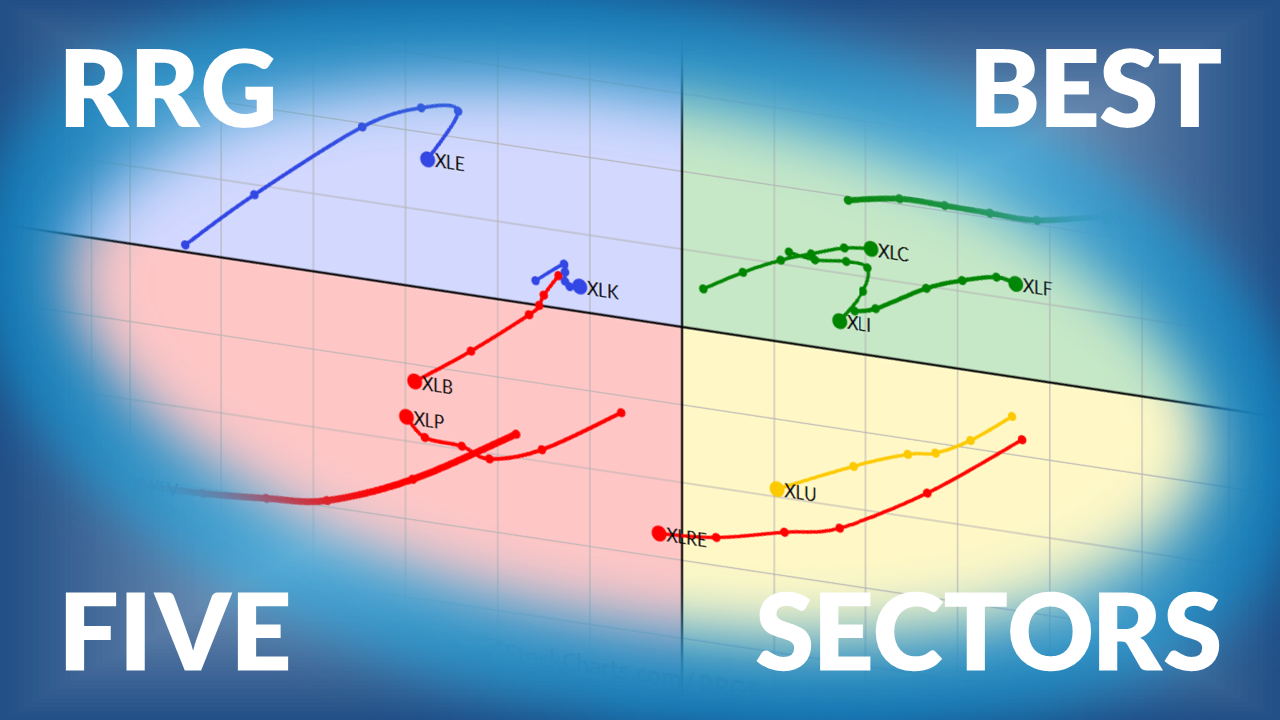
Energy Takes the Lead as Technology Falters
Six weeks have passed since the last ranking, which was dominated by Health Care, Technology and Consumer Discretionary. In that time the sector landscape has reshuffled dramatically. Energy, which sat near the bottom at the end of December, vaulted to the top by early February, while Technology slipped out of the top five.
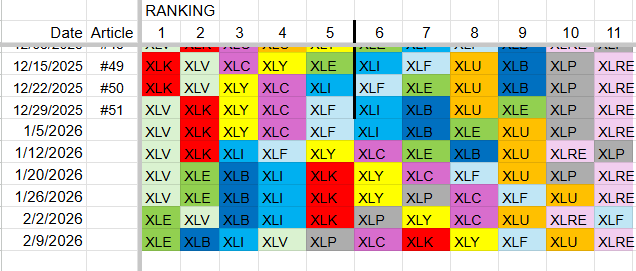
The color‑coded ranking chart below traces each sector’s movement over the past six weeks. Notice how Energy surged from ninth to first, and how Materials and Industrials followed closely behind.
Current Top‑Five List
- Energy (XLE)
- Materials (XLB)
- Industrials (XLI)
- Health Care (XLV)
- Consumer Staples (XLP)
The remaining sectors sit outside the top five: Communication Services, Technology, Consumer Discretionary, Financials, Utilities and Real Estate.
Weekly Relative Rotation Graph (RRG)
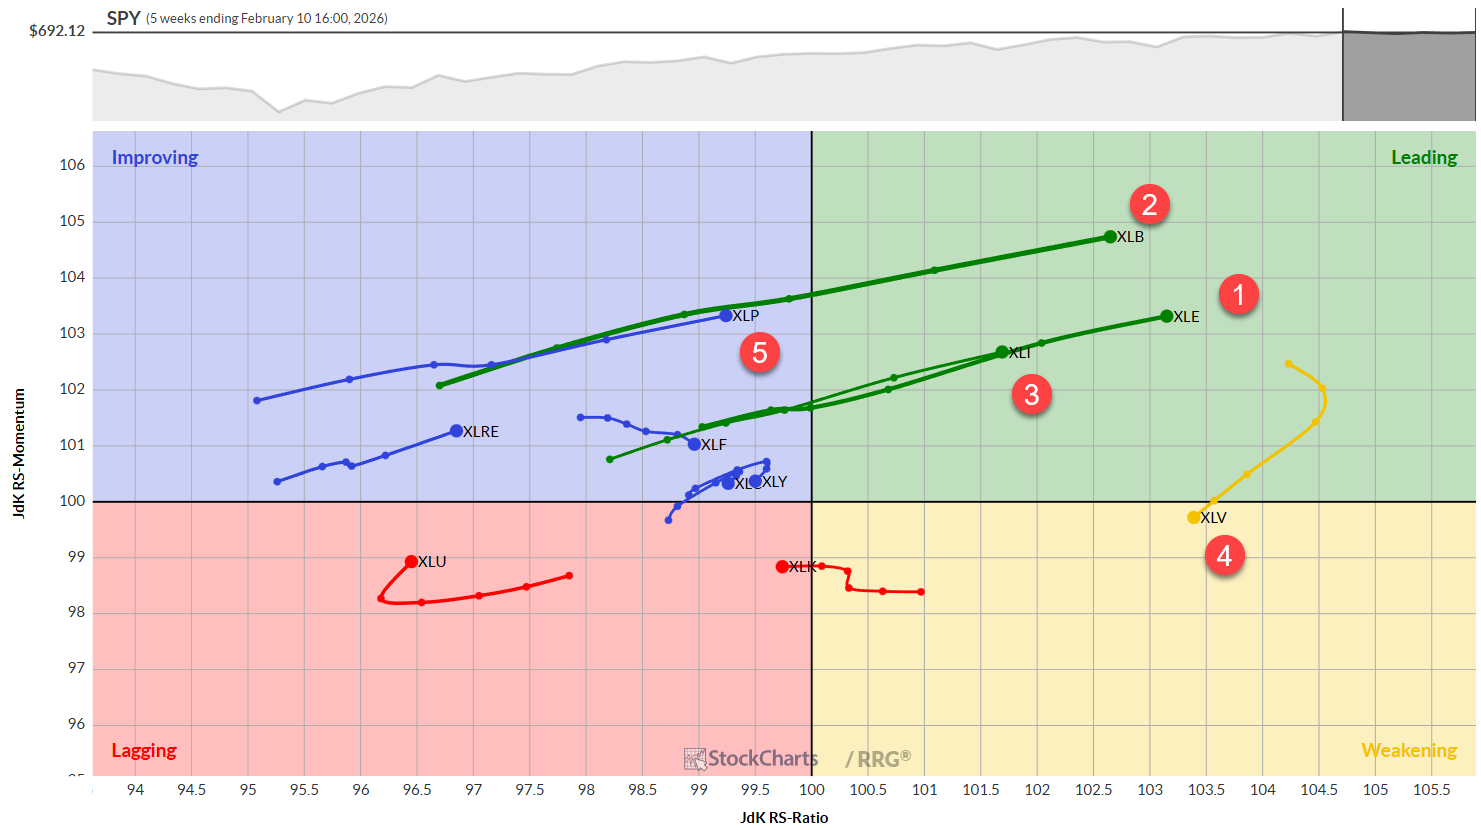
On the weekly RRG, Materials, Energy and Industrials sport long green tails that push them deep into the leading quadrant. Consumer Staples is also edging into the improving area. Health Care, despite its fourth‑place ranking, sits in the weakening quadrant but still holds the highest RS ratio for the week.
Daily Relative Rotation Graph (RRG)
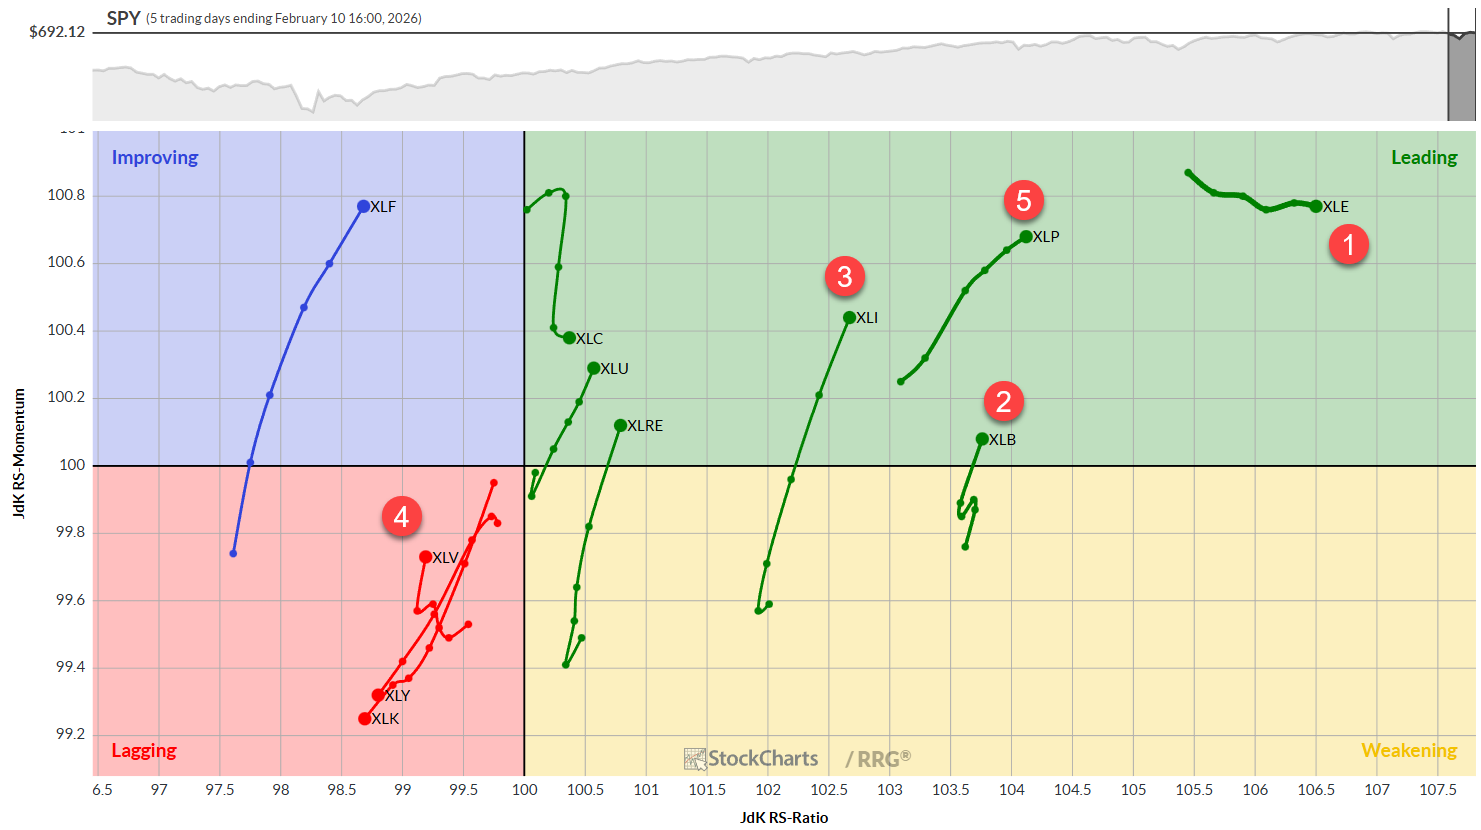
Energy leads the daily chart with the strongest RS‑ratio, firmly planted in the leading quadrant. Materials and Industrials have rotated back from weakening to leading, while Consumer Staples remains stable and upward‑moving. Health Care is the only sector still in the lagging quadrant, although it is beginning to regain momentum.
Sector Spotlights
Energy
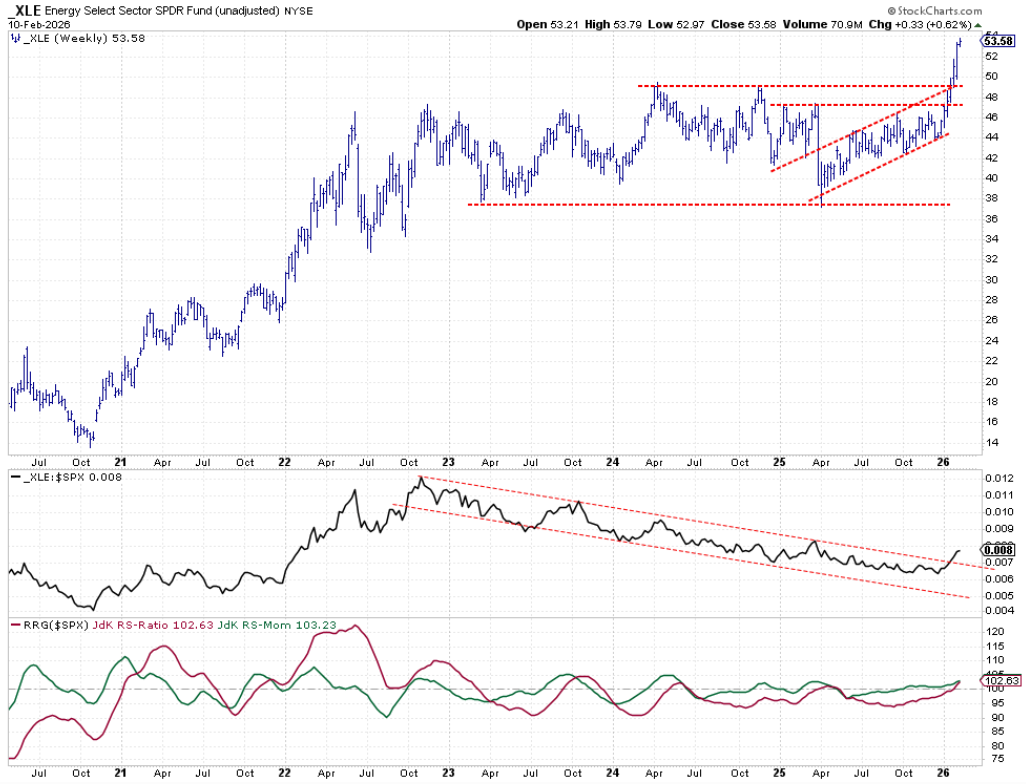
Energy broke out of a long‑standing range at the end of January and has set new weekly highs ever since. Both the raw relative‑strength line and the RRG indicators have cleared the 100‑point barrier, confirming a solid upward trend.
Materials
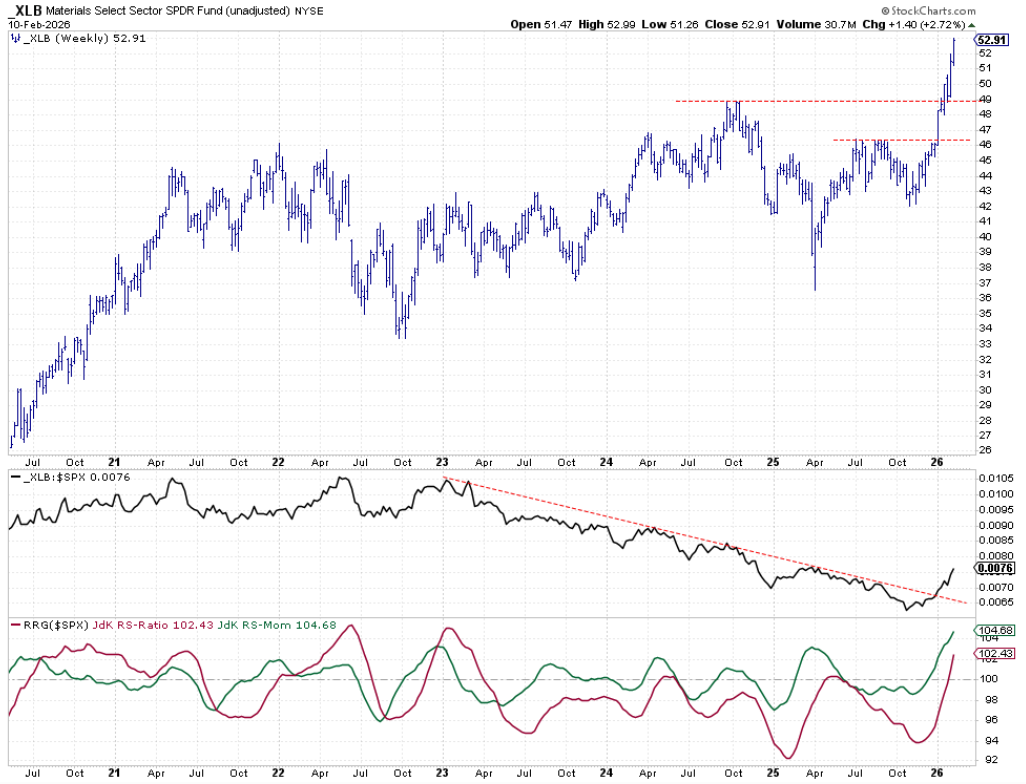
Materials mirrored Energy’s breakout, punching through a descending resistance line that had held since early 2023. The sector’s RS and RRG values now sit comfortably above 100, placing it deep inside the leading quadrant.
Industrials
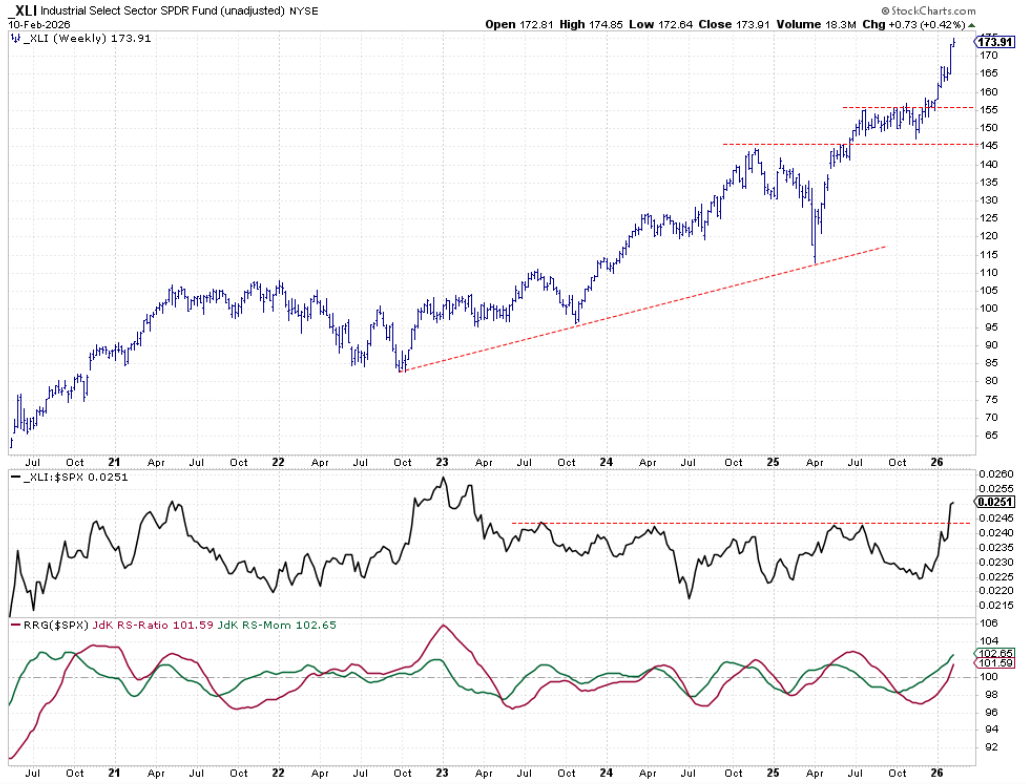
After a modest breakout in late December, Industrials gained real momentum in early January. The raw RS line finally escaped a year‑long resistance zone, and both RRG lines are well above the 100 threshold.
Health Care
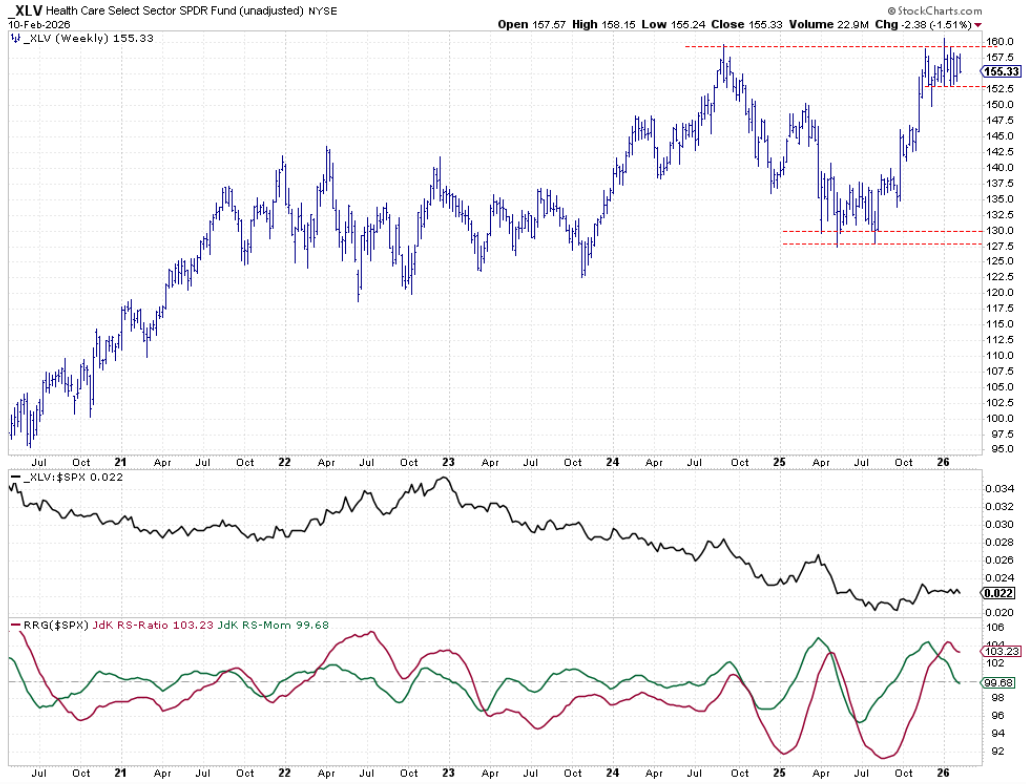
Health Care has been stuck in a tight range between roughly 152.5 and 160, unable to break its all‑time high. The sector’s RS line is flat, and the RS‑ratio has slipped below 100, moving the sector into the weakening quadrant.
Consumer Staples
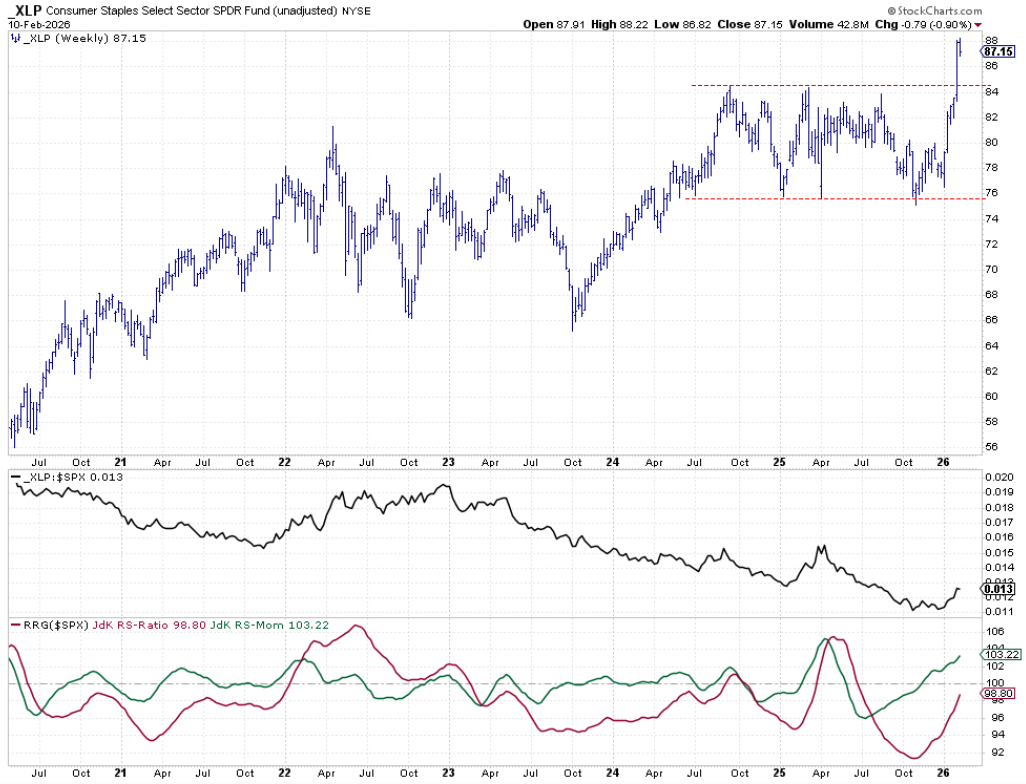
Consumer Staples finally escaped a broad 76‑84 range last week. The raw RS line is forming a clear bottom and trending upward, while the RS‑momentum line has already crossed above 100, indicating growing strength.
Portfolio Impact
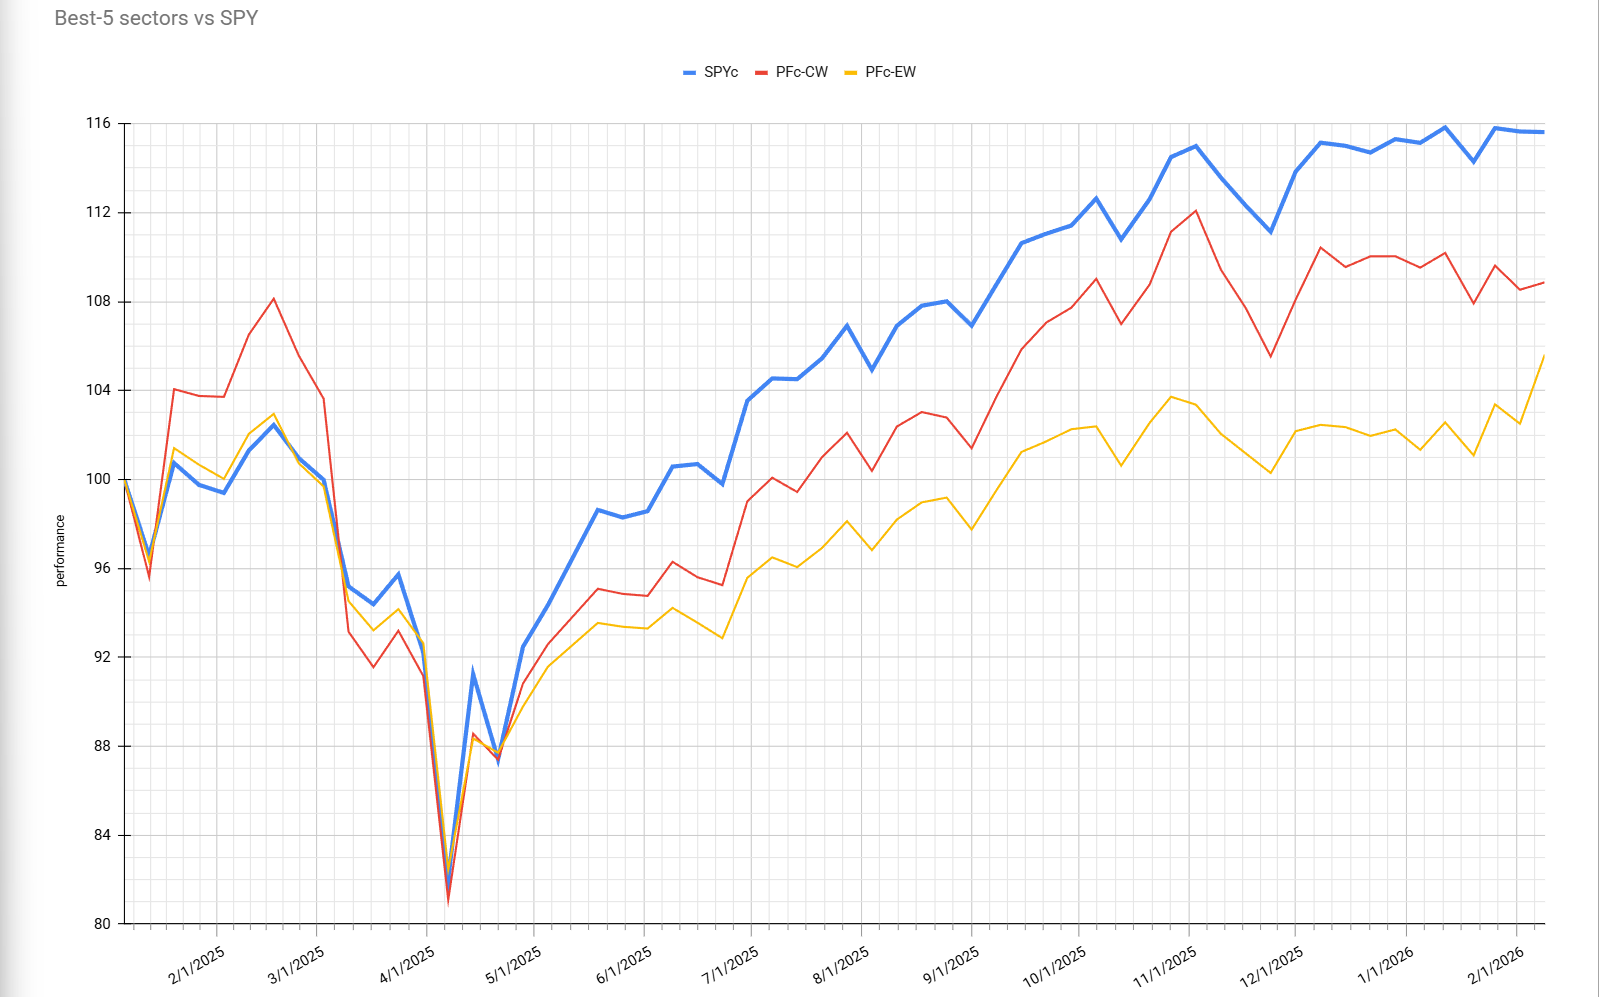
The recent shift has produced a noticeable jump in the equal‑weight portfolio because the heavy Technology exposure—now underperforming—was limited in that basket. In the cap‑weight version, the lagging Technology weight dragged performance, even though the sector was still among the top five.
Moving forward, both weightings will be tracked weekly to capture how sector rotations affect returns. Early signs suggest the approach delivers solid short‑term gains, though the longer‑term curve shows a modest flattening over the past year‑plus.
Stay alert to the weekly rankings and let the RRG signals guide your sector exposure.
Source: Materials provided by https://articles.stockcharts.com.Note: Content may be edited for style and length.